
Translated material
Python. Library Pandas, part 1

We begin to get acquainted with Pandas - the main library of Python for data analysis.
This is a very convenient and not the most difficult development of the tool-journalist. It allows you to work with data in the usual tabular form. In Pandas, you can study the data set, clean it, make changes, analyze and draw conclusions, build graphs and much more.
Unlike Excel, where there are also wide opportunities for working with data, Pandas will cope even with very large files in which hundreds of thousands and millions of lines. The standard Excel is not within the power, like working with files in JSON format - it is in this format that open data is often stored. For example, on the website of state -owners, data on state contracts and subsidies can only be uploaded to JSON.
We will devote several lessons to the Pandas library. Today there will be the first acquaintance: we will learn how to do the most basic things in Pandas, with which you can already analyze real data.
1. Create Datupharem from scratch
To get started, we load the Pandas library, we will turn it in abbreviated as PD.

If you do not work through the anaconda, load Pandas with the PIP3 Install Pandas command.
In Pandas, the data is presented in the form of a Dataframe, or a table with data. It can be created from scratch, for example, from dictionaries, lists or motorcies.
We will create our first Dataframe for the three largest cities in Russia. Before us is a dictionary in which City and Population are the keys, and the values are lists with the names of these cities and the population that corresponds to them.
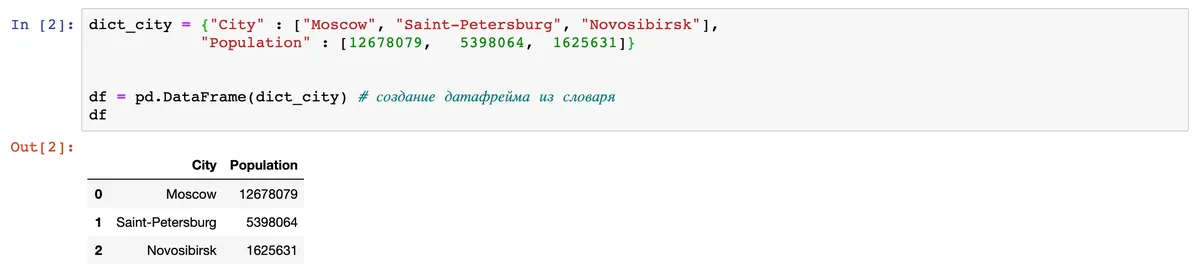
The first column indicates the index (serial number), and the rest looks like a familiar table.
You can also create a Datafrem from the list of lists.

This time, the values were signed by line, and it will be more convenient to change the lines and columns in places, that is, transparently.

Now we know how to create Datapham from scratch. But in practice, it usually has to be loaded from a file in Excel, CSV or JSON formats.
2. Create a Datapram from a file
Today we will work with human mortality data from different reasons. Let's move to the website of the Institute for Assessing US Health Property and choose the necessary death indicators for countries.
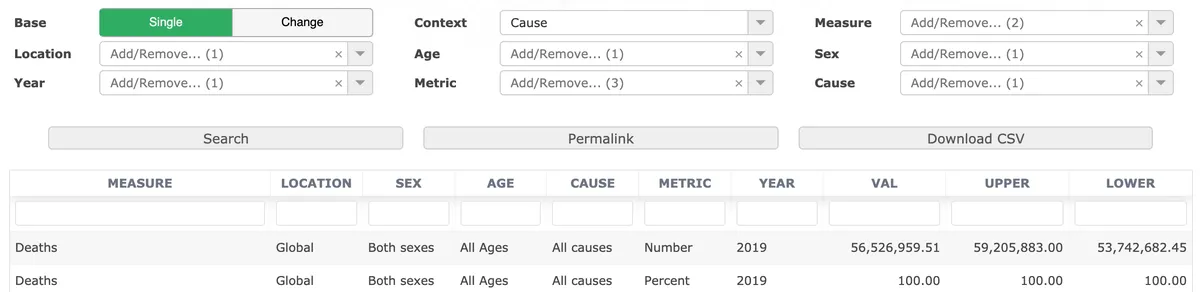
Let's choose the following indicators:
Location: Countries and Territories (countries and territories)
YEAR: 2000-2019
Content: CAUSE (cause of death)
Age: All Ages
Metric: Rate (the number of deaths from a certain cause of 100 thousand inhabitants)
Measure: Deaths (death)
Sex: Male, Female, Both
CAUSE: LEVEL 2 CAUSES (2 level of detail of the causes of death)
Next, click download csv (download in CSV format).
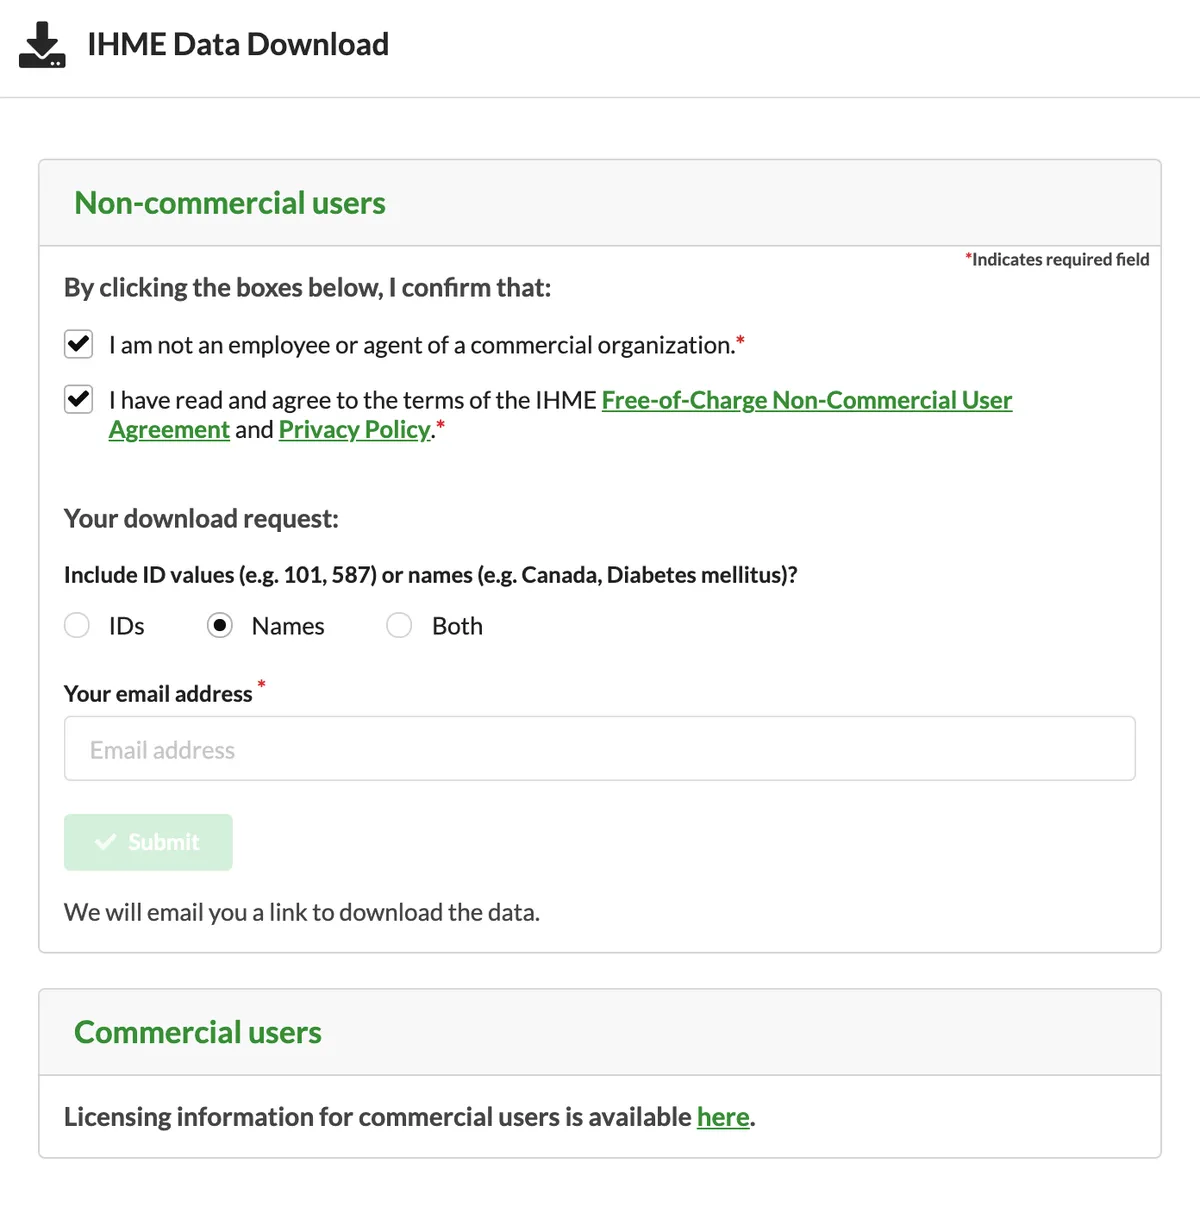
It is necessary to put checks, agreeing not to use the data for commercial purposes, choose Names and enter mail.
Data may not come immediately, so the same dataset can be downloaded by the link . This is a large dataset for 260 thousand lines with which it would not be easy to work in Excel.
We copy the path to the file on the computer and load it immediately to the Dataframe using the PD.Read_csv () method.

We will display the first 5 lines of Dataframe by .head ().

To derive an arbitrary number of lines, we indicate the right number in brackets.
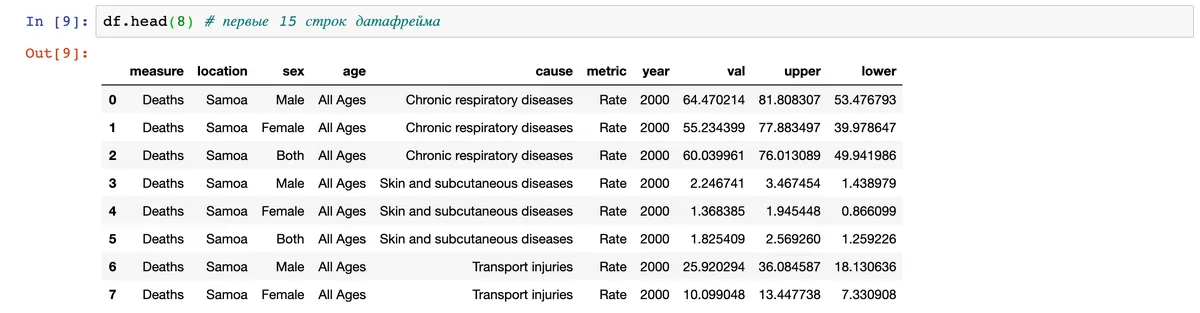
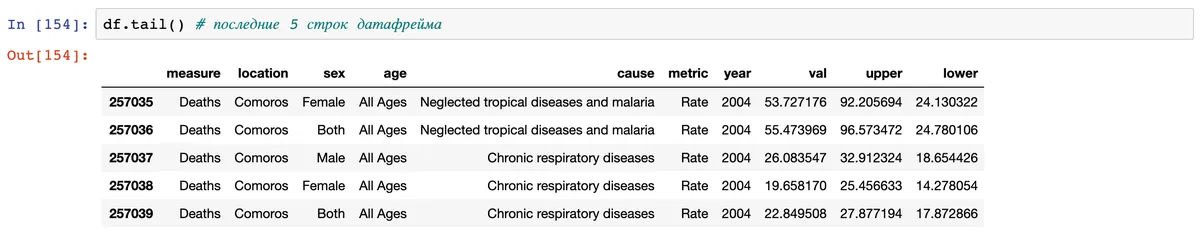
The last lines are displayed by .tail ().
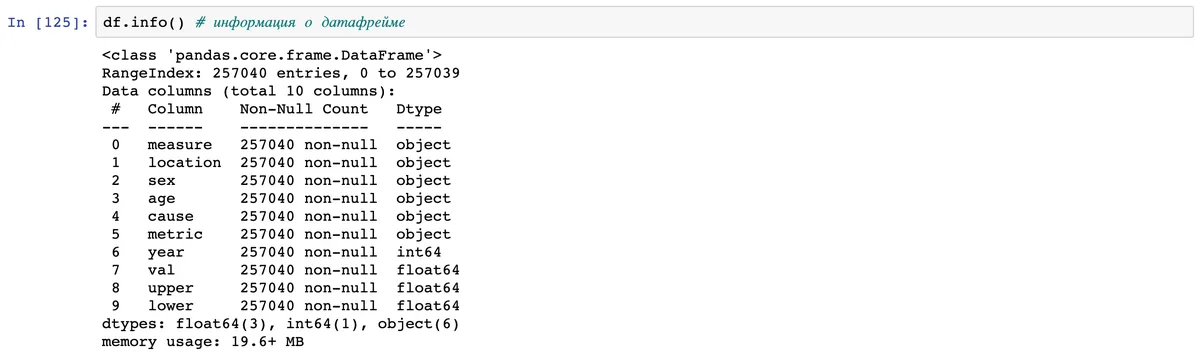
The df.info () method gives a description of Datapram: how many lines and columns in it, what types of data are contained, how many non-empty values (non-null), how much memory takes.
If we only want to find out how many lines and columns in it, we use the Shape attribute.

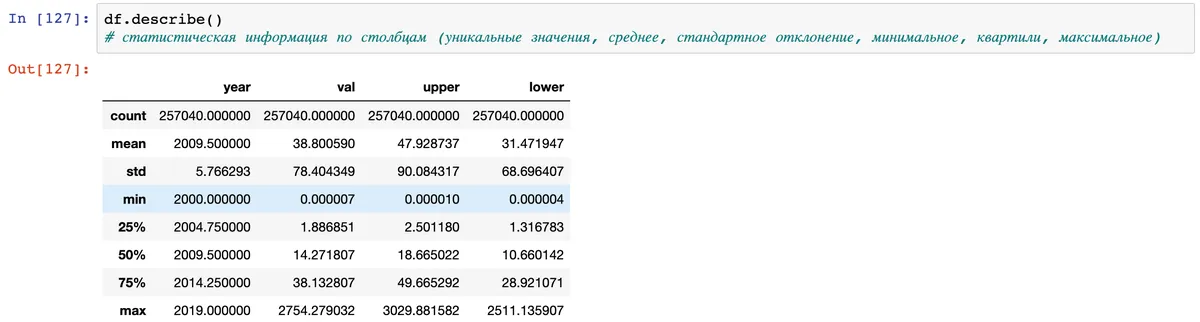
The Describe method gives statistics on numerical columns: the average, maximum and minimum, tenor, standard deviation.
If we need not only numerical columns for statistics, but all the rest, add the ALL argument.
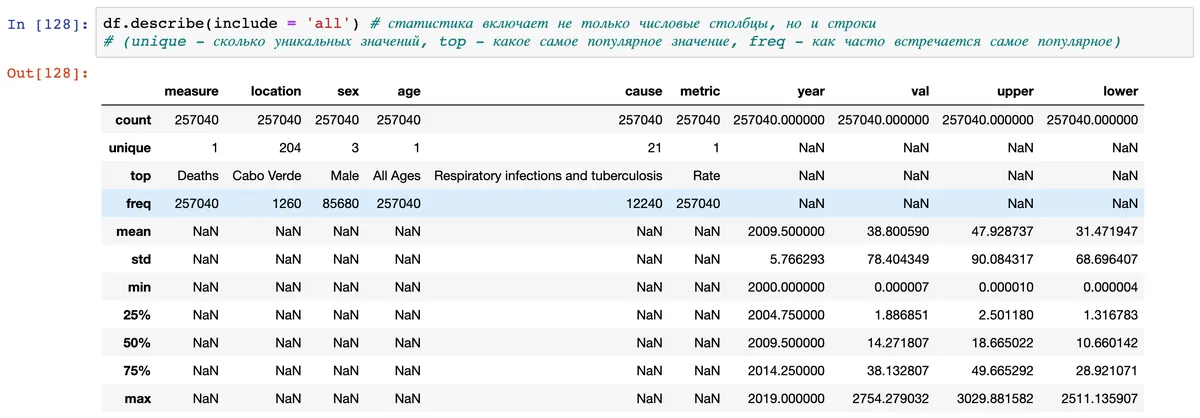
Then the unique fields (how many unique values are added to the table), TOP (what value is most common) and Freq (how many times the most frequent value).
We have no empty values in Datapham (Missing Values, Na), but often they are in real data, “pollute” them and prevent them from working with them. You can get rid of empty values by Dropna.

3. We filter Datapham by the name of the column and indexes
You can choose a certain column in two ways:
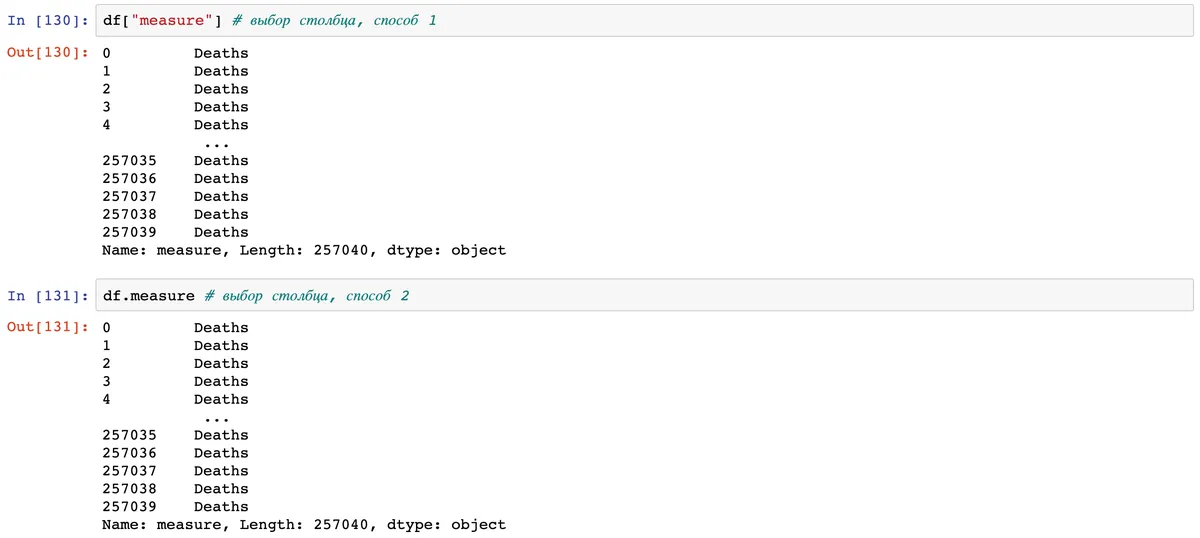
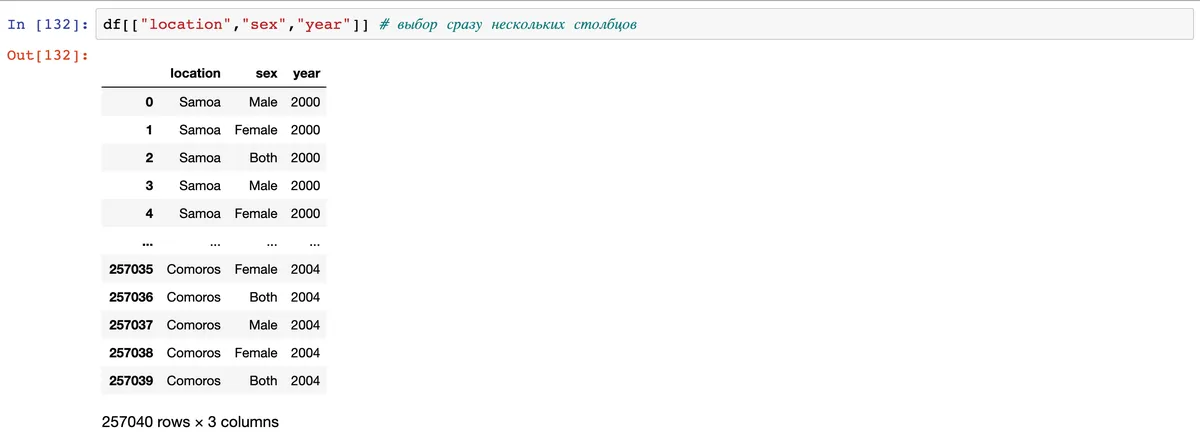
You can also display several columns at once, wrapping them in double square brackets.
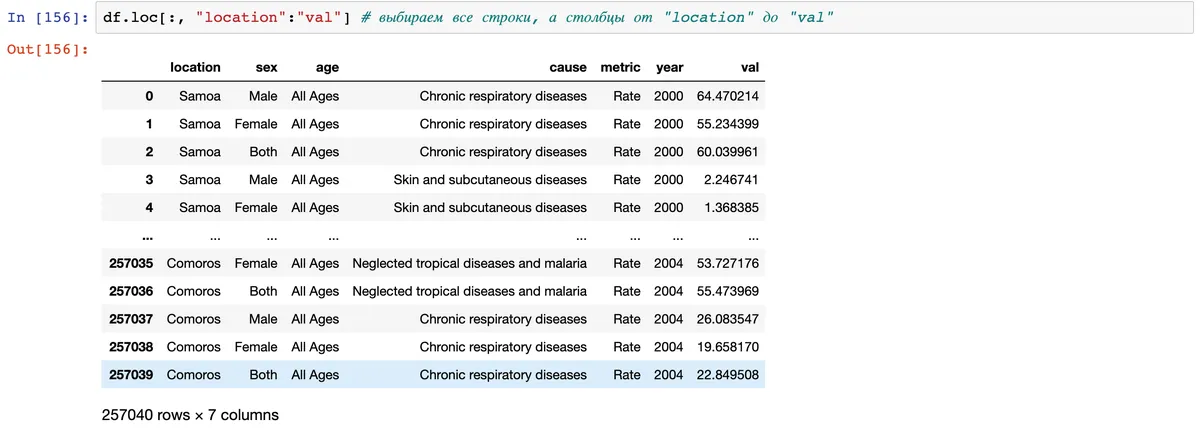
There are also Loc and ILOC methods to select columns and lines. Loc - for the name of the name, ILOC - by index (serial number).
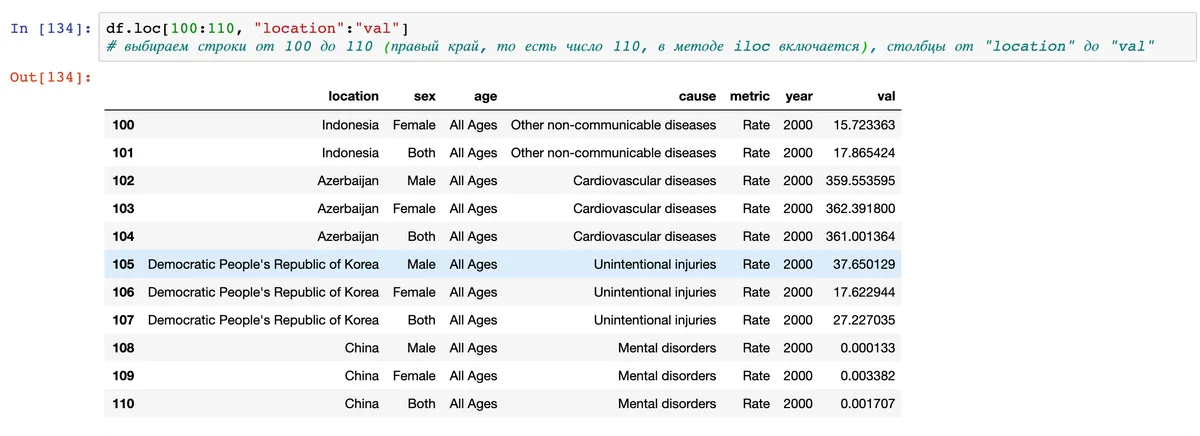
If we need only lines from 100 to 110, we will prescribe this condition on the left.
If we want to choose columns and lines not by name, but by number, we use the ILOC method. This is useful, for example, when the names of the columns are too long.
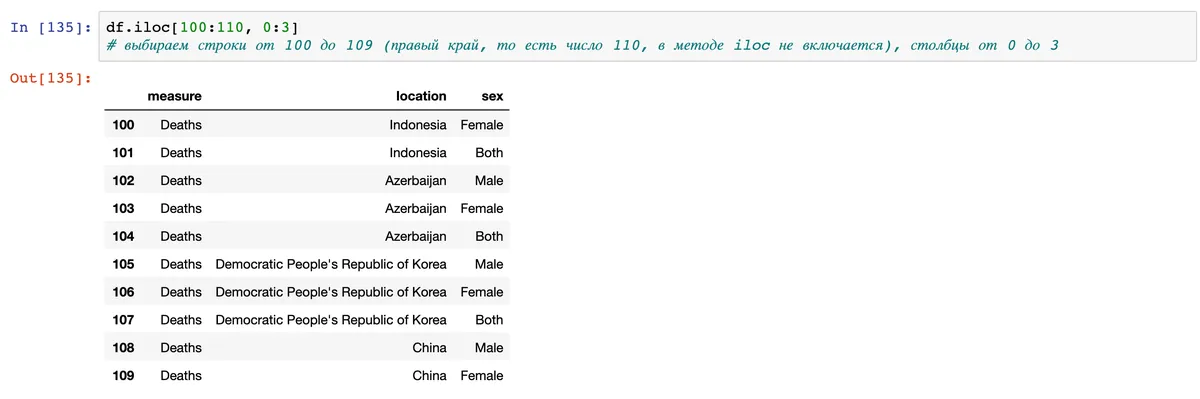
Important : the LOC method includes all the numbers indicated in the condition, so we see line 110, and in ILOC the right end is excluded (as in standard sections in Python), so the last line that we see is 109. To display the line 100: 110, it would be necessary to indicate df.iloc [100: 111 , 0: 3].
4. We filter Datapham according to the conditions
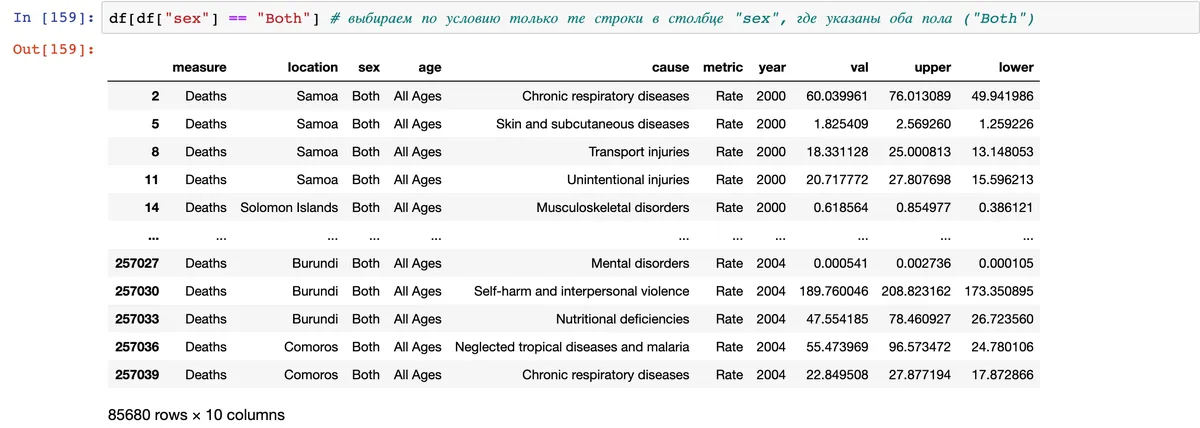
In Pandas, it is very convenient to choose data by condition. For example, we need mortality indicators only for Both Sexes, both sexes.
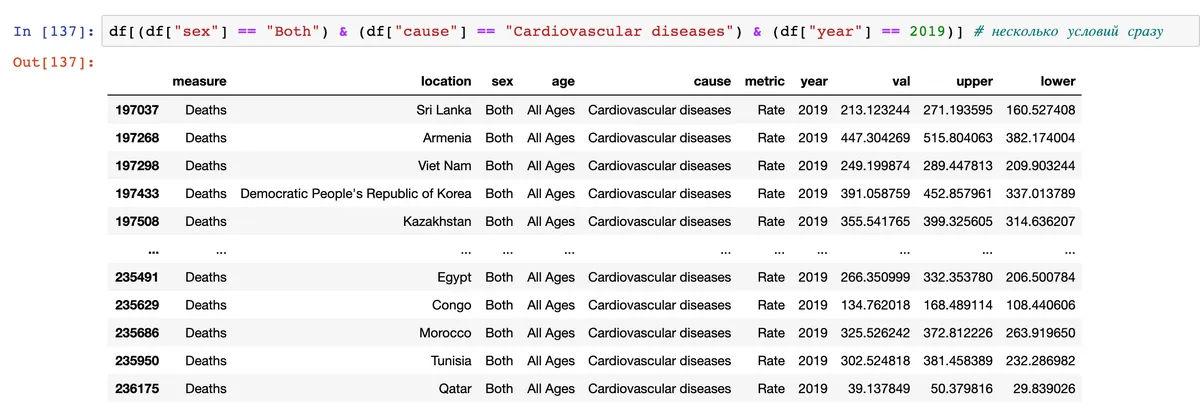
Or in three conditions: both sexes, only 2019, only cardiovascular diseases.
Or four: both sexes, only 2019, only cardiovascular diseases, only more than 600 deaths per 100 thousand inhabitants.
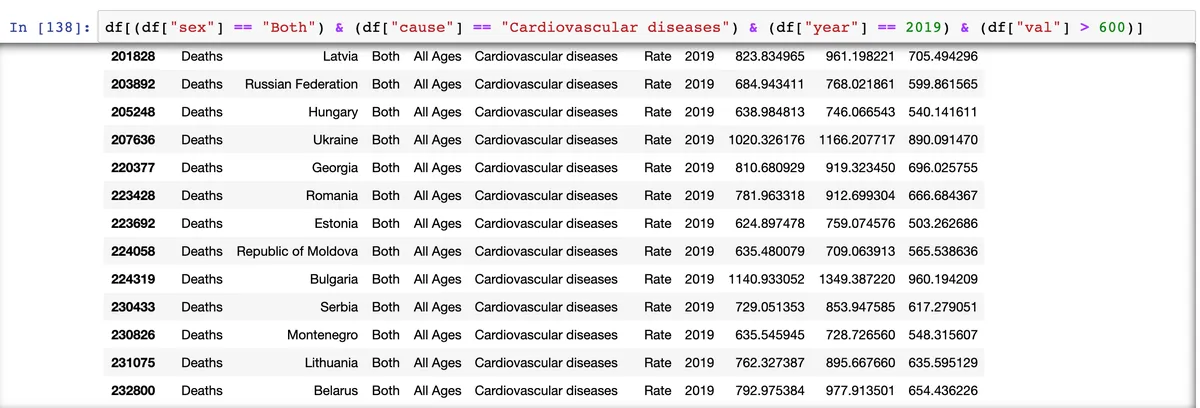
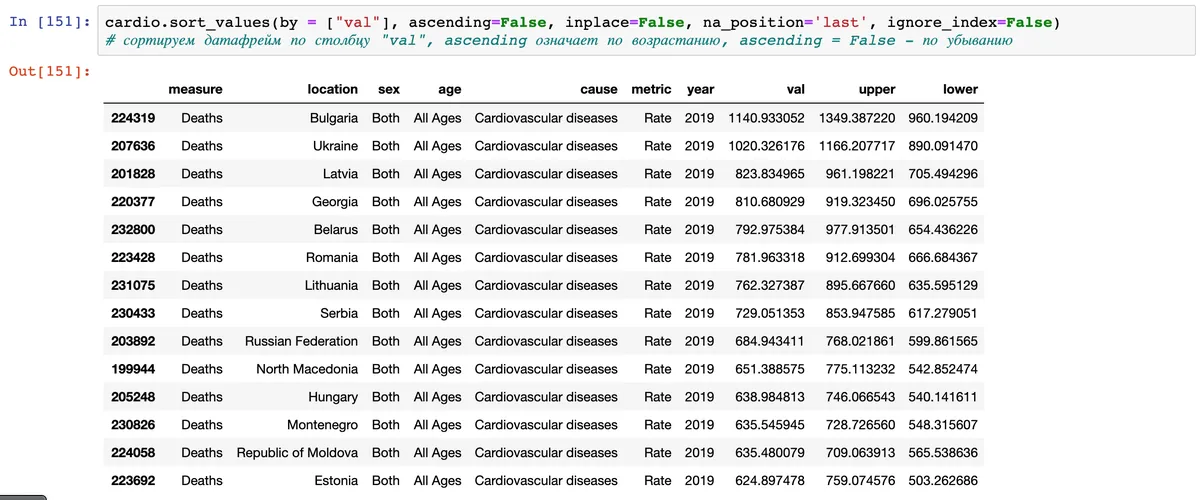
We see countries with the highest mortality from cardiovascular diseases. We will protect the result in a separate Dataframe and call it Cardio.

And we sort it according to the mortality rate from cardiovascular diseases. It turns out that most often they die from heart problems in Bulgaria.
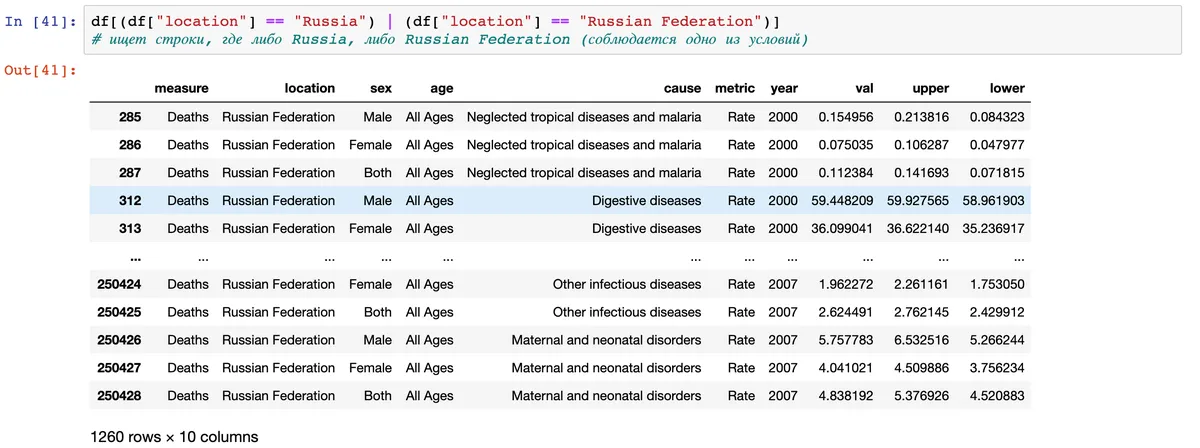
You can also set it so that either one condition is respected, or another with the help of the “or” operator:
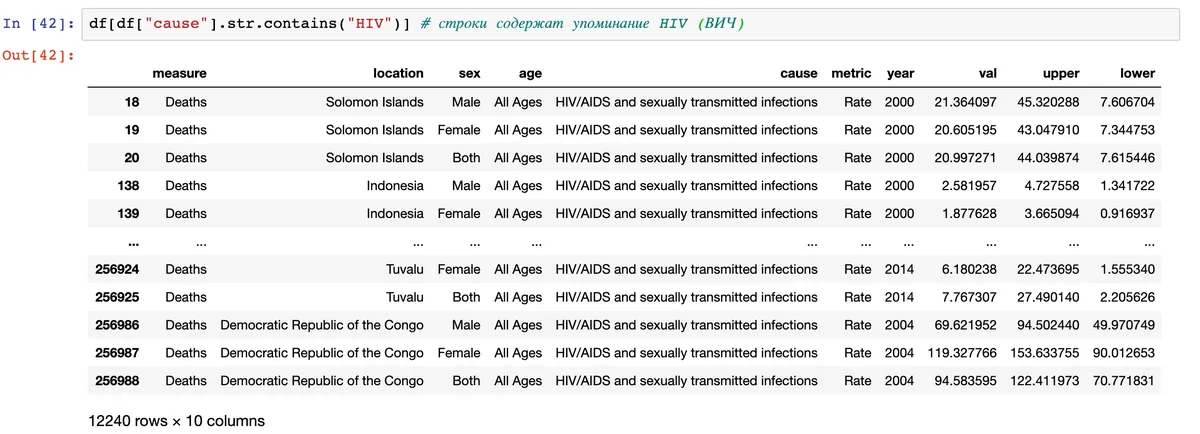
If we do not know exactly what the cause of death is called, or the name is too long, it is convenient to use the Contains method (contains). The Str.contains ("HIV") method will give us lines in which HIV (HIV) is mentioned.
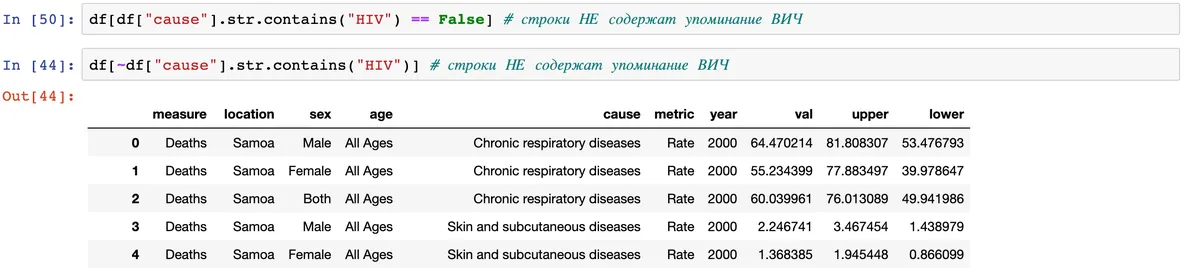
If we, on the contrary, need lines in which HIV is not mentioned, then you can add either the FALSE condition at the end or a sign ~ at the beginning.
5. Delete, add columns, change the name
It can be seen that the values in the column Measure, Metric, Age are the same. Also, we will not work with Lower and Upper columns (lower assessment of mortality rate and high), so they can be removed. To do this, use the DROP method.

To remove several columns, we wrap them in square brackets.
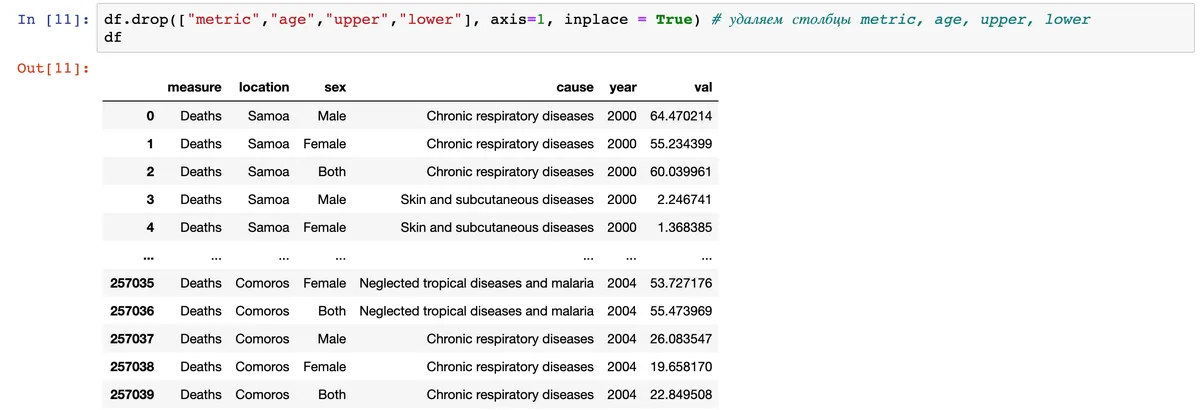
The argument Axis = 1 shows that it is necessary to remove the column (1 - columns, 0 - lines).
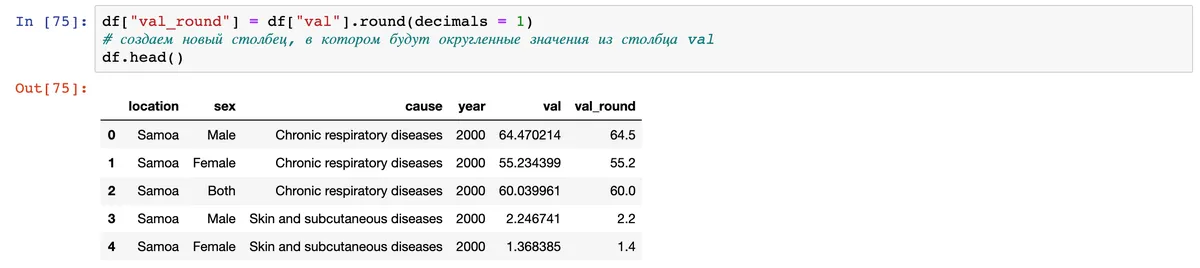
Now learn how to add columns. For example, add a column in which Val values will be stored, but only rounded to one tenth.
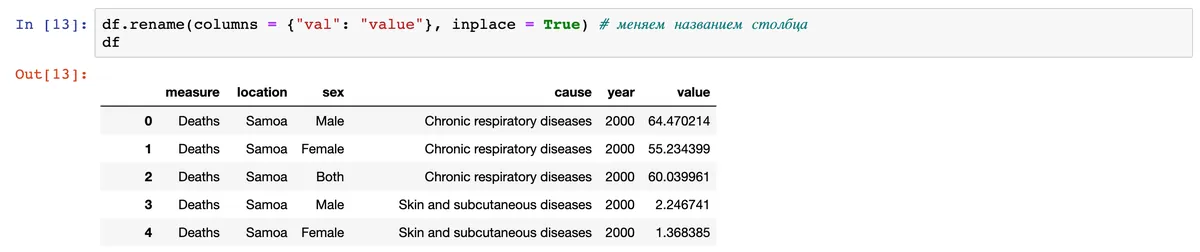
Rename the columns is also easy. Rename, for example, Val in Value.
6. Save Datapham
Datapham can be saved in CSV or XLSX and work with it further in any program. The name of the file should be unique, otherwise if you already have a file with that name on your computer, then it will be rewritten.

So we have mastered the necessary minimum for working in Pandas. A notebook from this lesson can be downloaded here , but ask questions and chat - in the Chat of the "Workshop" in Telegram .