
Translated material
That's all love
The true data of "voting" differ from the voiced cycle
Well, in fact, that's all. The "All -Russian vote" on amendments ended. At the time of writing on the official website of the CEC, the voting results of almost 80% of polling stations covering almost 90% of voters have already been posted.
Official results for turnout and results are calculated according to the published data set and may slightly differ from the final ones.
There were doubts: what will happen in such a strange and unusual voting method. Still, seven days of voting are not one. The extension of the procedure up to a week increased the possibilities of the advance of voters to the turnout - but maybe this will not affect the will? Or will it affect, but partially?
Everything turned out to be just banal. As in the picture.
In the right panel for each polling station, the results for (red), against (blue) and invalid ballots (pink) are marked with points.
On the X axis - the final turnout on the site.
On the Y axis - a percentage in the corresponding column of the protocol.
Green dashed crossroads - the official values of the turnout and the “yes” result.
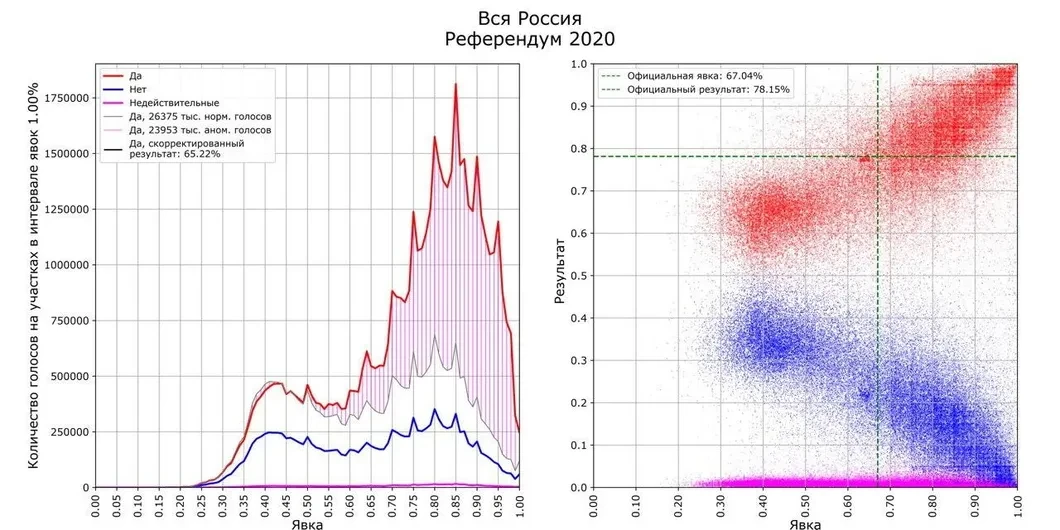
The first one can see - the general result is literally among nothing.
There are few real areas that would give out the result and turnout close to the official.
With the turnout and the result, “yes” is more - a lot. Less is also a lot. And around official values - failure.
Second: the results of "yes" in the areas are grouped into two clusters. One, smaller - a round blurry stain around the turnout is approximately 42% and the result is about 65%. The second, larger, is separated from it by failure, the “comet tail”, which goes up to the one hundred percent appearance and one hundred percent result. If you look closely, the comet tail is also drawn with a neat cell after 5% (and smaller - after 1%). Somewhere we have already seen it, it seems. This is how the results in the elections look when the right candidate throws additional votes, increasing the turnout and its result. Well, at the same time sometimes they draw one or the other to a beautiful number of interest.
A round blurry spot by 42% of the turnout and 65% for - these are just those areas where it was honest.
The picture on the left panel also looks familiar. Here, along the X axis - a turnout, along the Y axis - the number of votes “yes” and “no” in areas with such a turnout (in the interval of 1%). The thin gray line is the result “no”, scaled so that its beginning coincides with the “yes” schedule. At first, both graphs go in proportion to each other, then, starting with a show of 50–55% (this is just the border of the first cluster in the right panel), diverge: “Yes” goes into the gap (the difference is shaved). It’s just to understand: where they counted honestly, the turnout can be different, but the number of votes for will be proportional to the number of votes against.
The right half of the schedule is beautifully decorated with peaks on a multiple of multiple 5%. We have long known this phenomenon under the name “Saw Churov” - these are the consequences of administrative votes for the right candidate
In the areas, when at the same time they draw “beautiful” (round) turnout (note that there is practically no “saw” on the left part). The number of thrown out can be estimated by a shaved area - in case of pure dedication of the votes, this assessment is accurate, in case of throwing from the candidate to the candidate (in our case between “yes” and “no”), approximate. According to current data, it turns out that from the voices “yes” under suspicion is a little less than half. If they subtract them, the adjusted “yes” result is about 65% - in full agreement with the location of the first cluster on the left panel.
Alas, it has to be recognized that the results of the “referendum” on a significant (apparently, larger) part of the country's sections are drawn, and the real ratio for and against is approximately 65% by 35% with a real turnout of about 42%.
There is a sequel
Russia has not yet seen such a distribution of votes. And the world, perhaps, too. Explain on the graphs