
Translated material
How to improve Hirsch index?
Traditionally, the performance of the scientist was evaluated by the number of articles. Then there was citation. Finally, in 2005, the Hirsch index, h.
This is a very indicative value. The index is equal to H if a person has h of articles with citation above H. That is, if h = 12 (which is considered a good result), then a person has 12 articles, each of which has citation above 12. Hirsch-index is good because it distinguishes stable scientists who give out a lot of good works. In my opinion, it is a successful addition to integral parameters such as full citation.
It is obvious to everyone that the productivity of the scientist cannot be reduced to one number. But a good set of parameters can already give (at least on average) a rather adequate picture. This will never replace a good expert assessment, but it can not always be obtained. Therefore, the activity of inventing new indices and modernization of existing is very meaningful and in demand. There are a large number of modifications of the Hirsch index. Different options strive to take into account self -cy, weed out the so-called “mass graves”, divide the sightseeing and original articles, take into account the time factor, give greater weight articles with high citation, etc. In the archive ( arxiv.org ), articles on this topic regularly appear. In a recent work (Arxiv: 1005.5227), Michael Schreiber analyzes different options for Hirsch index, using data from 26 physicists from one European Institute. Let's see what happened.
Schraiber initially considers six quantities. This is the full number of publications N, the number of publications with non -zero citation N1, Hirsch Hirsh index, as well as indexes W, H2, HR index W is determined as follows: 10W <c (W), but C (W+1) <10 (W+1), where C (W) - the quote with the number W (the articles are ordered by citation, number 1 has the most cited). That is, W = 3 corresponds to the fact that a person has three articles with a quote above 30, but the fourth already has less than 40. Further, the H2 index is defined as H 22 <c (h2), but C (h 2+1 ) <(h 2+1) 2. That is, if a person has h2 = 5, then he has five articles with citation above 25, but the sixth has citation of less than 36. To rank people with the same Hirsch index, the Hi interpolation index is introduced. It is located in the interval h <h i <h +1 and is determined by linear interpolation Ci (x) = C (h)+(xh) (c (h+1) -c (h)), hi = c/hi).
Obviously, W and H2 give greater weight articles with high citation (highlighting, as they say, a more compact “core” in a set of publications) than a simple or interpoed Hirsch index, and N and N1, on the contrary. At the same time, W and H2 are coinciding with a large number of people, especially W. Among the considered 26 lists, only 7 different values W “fell”, and the value W = 4 corresponds to a dozen scientists at once.
It is worth noting that the ranking of H, Hi, W and H2 , of course, coincides, with the only reservation about the same values W and H2, and sometimes H, for different scientists. But the leader (among the 26 scientists considered) in the number of publications and the number of publications with non -equal quotation turned out to be only the fourth in such a list.
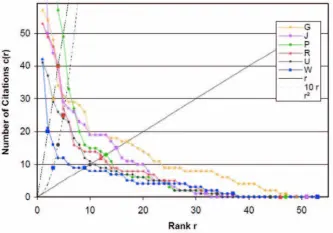
Figure 1 shows data on 6 scientists (the number 26 was not chosen, it simply corresponds to the number of letters in the Latin alphabet, i.e. the names of scientists whose lists of publications are used in the study do not appear in the article.) Three lines that go out of the beginning of the coordinates correspond to three indices, for ordinary hirschu, long barns - index - index - index. W, short strokes - H2 index.
All the indices considered have an important drawback: if the article has already entered the “citation core”, then it does not matter how great the full number of references to it are. This is generally a lack of all "hirting" indices. Two people with the same indices can have complete citation, which differs significantly or dozens of times. Therefore, they like to introduce coefficients in one way or another related to the average number of links to the article. We will denote the average number of links CN. The argument of this value may be the article number in the ranking. In addition to the banal division of the full number of links into a full number of articles, modifications are introduced. For example, the index A = cn (h) = s (h)/h. Here S is the sum of the number of citation from the most cited article to an article with number h. That is, the average number of links is determined only by the "core" corresponding to the Hirsch index. Other modifications are somehow related to the allocation of this “nucleus”. For example, it is proposed to take the root from the full number of articles, i.e. If a person has 150 articles, then the averaging will go 12 most cited.
If you look at 26 of the selected lists of publications, then the ranking is not very different from the described above, only people with a small number of very highly focused articles rise in the list and are sagged by those who have a very long list of publications with the same full citation and the same h.
At the same time, Schraiber believes, it is poorly based on the full number of publications, since this is a poorly defined value in itself, if you do not introduce rigid selection criteria. Automatically, databases (and all reasoning is usually applied to those data that are easily available in the database without additional processing, therefore, for example, all indices are considered without throwing self -cycling, which is annoying) include any “small things”, which is often difficult to get rid of flags and tags. Therefore, I would like some self-mocking allocation of the “nucleus” of publications, an alternative to Hirshevsky.
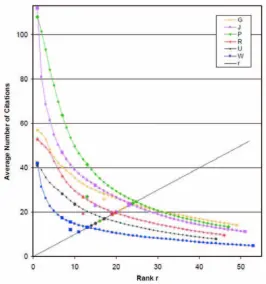
The alternative is very similar to the Hirsch index itself. This is the index G: G = C N (G). That is, a person has G of articles with medium citation, more or equal to G. That is, it is almost the same as the Hirsch index, but not just for the quote and articles arranged on it, but for the average quote and ranking in this value. Figure 2 shows the corresponding schedule. The intersection of a direct line from the beginning of the coordinates with a color corresponds to the indicator G for a given scientist. Similarly, HI can be introduced GI, which is done.
The maximum case is the citation of the most cited article (the “core” consists of one article). From the analysis it is clear that the ranking in this value is very different from other, more smoothed and average approaches. Schraiber concludes that by the most cited article, it is bad to judge the integral contribution of the scientist. Although, we note, we are not talking about certain cases of special genius, but about the indicators of quite medium (in a good sense) scientists. For them, of course, to build some kind of ranking based on the fact that one has the most cited article has 53 links, and the other has 47 is bad.
We move on. The average can be taken differently. For example, you can take a median. And, of course, there are such indices. For example, we take the “core”, determined by the Hirsch, and we look at the median citation in it. We get the index of CT. You can take a harmonic or geometric average. And there are such indices. Schrey-Ber shows that although all this is not bad, but with greater difficulty in determining it does not give any winning in the end.
People play with other options. For example, with a square root of a total number of quotes on the "nucleus". For example, there is a good option for determining the G index as a square root from S (G). Schreiber distinguishes an interpoled G (i.e., the GI index) as one of the best parameters.
Further, there are very complex indices. For example, you can determine the “entropy” of the quotation list (the maximum entropy has a list where all articles have the same number of links). Here, again, an analysis of the sample of 26 quoting lists shows that an increase in the complexity of calculating the coefficient does not lead to new positive properties.
Interesting (but complex) indices arise if, after highlighting the “nucleus on the Hirsch”, they try to take into account how “the tail” can soon enter the “nucleus”. In this case, the closer the article in the rank to the border of the nucleus, the greater the weight receives its citation. That is, if two scientists have absolutely the same “Hirsch nuclei”, but one has almost empty behind the “nucleus”, and the other has many articles that are about to enter the “nucleus” (that is, the Hirsch index will increase), then the second will have the best indicator.
Finally, there is an interesting Maxprod index. It is determined at the maximum (according to R) work RC (R). Here R is the number (rank) of the article in the list, ordered by citation, and C (R), as above, is the citation of the article with the number R. Typically, this index is higher than H2, as a rule, associated with high quoting of articles inside the “core of the Hirsch” (say, at H = 12, according to NASA, ADS Maxprod is 240 due to the fact that the eighth article in the list has cited 30, but it could have been different if, say, an article with a number 50 would have it. citation 5).
Of course, it is worth watching how different indices correlate with each other. The full number of publications (N) and the number of publications with non -zero citation (N1) are worst with other indices (N1). Then, from the number of described above, the indexes W and A. After - that , say, the Hirsch index, the G and MAPROD index correlate with each other, i.e. Indexes based on a large number of articles (for example, on all), or, conversely, indices based on a very small “nucleus”, are poorly correlated. How the best shreiber is highlighted by an interpoled G-index. In his opinion, it is worth adding its automatic definition in leading databases.
In conclusion, we repeat Schraiber's words that it is more important not the quality of the index, but the quality of the base. Therefore, it is better to use the most primitive, but in a suitable base than the best, but bad.