
Translated material
Alcoholic mortality marathon
The statistics of alcoholic mortality leaves much to be desired: from 1990 to 2001, direct and indirect alcohol losses exceeded 7 million people: the most closely connected with alcohol is growing from west to east and from south to north: which regions suffer the most severe losses: alcohol mortality: Russia amid other countries
Continuation of the table
 Note: The severity of alcoholic mortality is indicated from 1 (the smallest) to 7 (the largest). Each federal district shows the share of regions of different severity.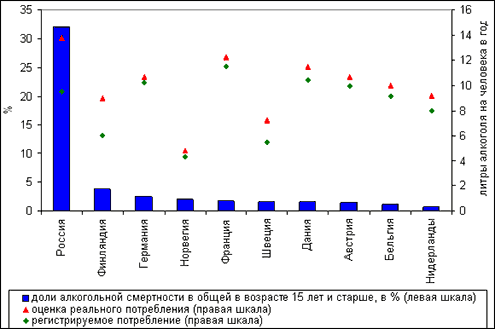
Russian alcoholic mortality statistics leave much to be desired
The human losses in Russia in connection with alcohol consumption are excessively high: in our assessment, about a third of all deaths are more or less associated with alcohol. This is ten times higher than the assessments of the State Statistics Committee of Russia (3% total mortality). But official statistics take into account only direct losses when alcohol is the main cause of death (for example, with alcohol poisoning), and these alcoholic losses are not completely taken into account. It is not reflected in Russian statistics and surpasses alcohol damage when alcohol is not the only, but significant factor of death.
Now far from all types of alcohol pathology are reflected in the official list of death diagnoses, as a result of which many types of alcohol mortality are “dissolved” in larger classes of deaths and are thus inaccessible for analysis.
Another feature of alcoholic mortality statistics is that many of its forms are hidden under the mask of non -alcohol diagnoses. This was confirmed at the beginning of the anti-alcohol campaign, when the indicators of almost all types of mortality, including cardiovascular, decreased accordingly to a decrease in alcohol consumption. Many death classes include alcohol mortality in the form of indirect alcohol losses (alcohol pathology as a concomitant disease) and direct - due to the falsification of alcohol diagnoses of death, for example, such as alcohol poisoning.
The regional statistics of this type of mortality, which usually serves not the only, but the main indicator of the severity of alcohol problems, was especially inaccurate: among the types of mortality related to alcohol, it had the largest variability in the regions, the largest asymmetry of the distribution of regional indicators due to the disproportionate number of very low values of the indicator. In addition, the level and dynamics of mortality from alcohol poisoning in half of the regions did not correspond to the level and dynamics of the incidence of alcoholic psychoses, and this contradicts the nature of these phenomena: all those who have suffered psychosis and most alcoholism who died from alcoholism. In other words, both are recruited almost from the unified cohort of the population, which involves the correlation of these types of incidence and mortality.
Such a correlation was observed in terms of the constituent entities of the Federation (in 44 of 77 studied): the dynamics of psychoses corresponded to the dynamics of poisoning. But in this group of regions, not everything was safe with registration of poisoning. For example, in Moscow, psychoses were recorded 20 times more often than poisoning, and the Magadan region - 6 times more often, while in most subjects of the Federation of this group the ratio was much smaller: for example, in St. Petersburg, the ratio of psychosis and poisoning was 3.8, in the Perm region - 1.8.
In the remaining 33 regions (out of 77), where the dynamics of psychoses and poisoning was uncorrected, this attitude in 1994 ranged from 1.2 (the Republic of Buryatia) to 35.8 (Rostov Region).
A special analysis made it possible to determine the real ratio of psychosis and poisoning as 1.89: 1.0 and a certain scatter of this indicator (from 1.29 to 2.47), which made it possible to adjust mortality in poisoning in terms of incidence of psychoses. Such a correction allows us to argue that the real amount of fatal alcohol poisoning in the country is 1.65 times more than state statistics show, although official data is already huge - 41.1 thousand people in 2001.
The adjusted assessment of deaths in alcohol poisoning is 67.6 thousand people. It is possible that this assessment is somewhat underestimated, since not everything is safe and with the registration of psychoses, although it, of course, is much more accurate than accounting for mortality in alcohol poisoning.
What are the sources of errors when registering these deaths? The partial answer contains the work of E.A. Tishuka [1] , which shows that some of the suddenly dead, who, as the cause of death, diagnosed the pathology of the circulatory system, found deadly doses of alcohol in the blood (4% or more), i.e. In a medical certificate of death instead of “random poisoning by alcohol,” a cardiovascular diagnosis was made as a cause of death. With this erroneous diagnosis, the described cases of death were included in state statistics. The explanation of this fact includes a "subjective component, which consists in undesirable moral, social and material consequences for relatives of the dead diagnosis of random poisoning by alcohol and their efforts to ensure that the sound of the state has been more neutral." Living in Russia will easily understand in what form and direction the "attached efforts" of these relatives were realized.
There are also several private evidence that in addition to the “subjective component”, sometimes there is pressure on the forensic service by the local administration, dissatisfied with high alcoholic mortality rates.
Russia's losses from alcohol mortality are huge
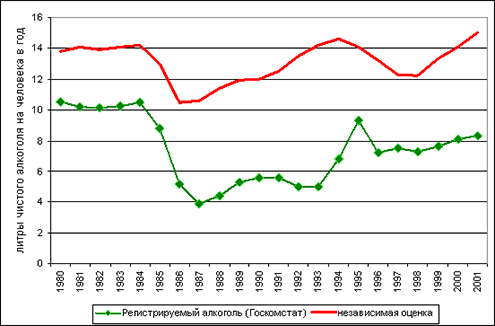
In the past two decades, Russia has experienced two alcohol shocks - the 1985 anti -alcohol campaign and 1992 market reforms. The main content of the first is sharp, by 63% (from 1984 to 1987) a decrease in state sale of alcohol and, accordingly, a decrease in alcohol consumption. This provoked almost the same rapid growth of moonshine, which by 1992 compensated for the shortage of state sale. In market reforms, the main thing for our topic was the growth of consumption due to the growth of state sale and the access to the alcohol market of a large number of toxic falsifications.
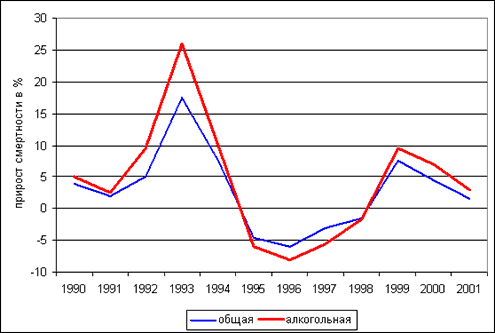
These two phenomena, together with some others, launched the process of fluctuations in the level of alcohol consumption (Fig. 1), and at the same time the total mortality rates (Fig. 2), which decreased in 1985-1986, reached the initial level in 1991-1992, sharply increased in 1993-1994, again decreased by 1998 and re-grew up by 2001.
Figure 1. Alcohol consumption (since 1994 - “sales volumes”) according to the State Statistics Committee of the Russian Federation and an independent assessment of real consumptionChanges in general and alcohol mortality occurred synchronously, although in 1991-1993 the growth of alcoholic mortality was ahead of the growth of the total (Fig. 2). This is due to the increased availability of alcoholic beverages, their cheapness and the fact that the cohort of heavy consumers increased sharply due to those who have saved their lives during the anti -alcohol campaign [2] . A more sharp decrease in alcohol mortality in 1995-1998 is associated with a number of factors, one of which is the massive extinction of the main consumers of alcohol in the first three years of market reforms [3] .
Figure 2. The annual gain of mortality - general and alcoholIt is impossible to imagine that in the determination of such a complex social process as the mortality rate of the population of a large country, only one factor acted - alcohol. However, it is difficult to assume something else: so that the general, cardiovascular and other mortality completely randomly changes synchronously or symphasiously with those types of mortality that are rigidly dependent on the level of alcohol consumption (alcohol poisoning, suicide, murder, cirrhosis of the liver and pancreatitis). Also, symphasized “non -alcoholic” types of mortality correlated with the level of alcohol consumption and incidence of alcoholic psychoses.
Given the imperfection of existing state statistics, we attempted to evaluate the contribution of alcohol to mortality from various causes, using an approach that allows at least partially reflect the cases of alcohol on mortality that do not fall into the field of view of state statistics.
For the analysis, the types of deaths were chosen, which are strictly dependent on alcohol consumption (in brackets, the share of deaths in the total number of deaths in 1980-1989 and 1990-2001 was indicated in brackets: (1) alcohol poisoning (1.4% and 1.6%); (2) suicides (2.8% and 2.6%); (3) murders (1.0% and 1.8%); (4) other types of injuries, poisoning and accidents, minus the above (road injuries, when falling, electrical trauma, drowning, death in fires and others; 7.5% and 8.3%); (5) liver cirrhosis, including alcoholic (0.9% and 1.1%); (6) Pancreatitis (0.27 and 0.31%).
In addition, numerous, but moderately related to death alcohol from: (7) cardiovascular diseases (55.1% and 54.3%) and (8) of the rest of the pathology shown above the above species, i.e. pathologies of respiratory, gastrointestinal (minus cirrhosis of the liver, pancreatitis), nervous and other systems; 31.0% and 30.0%, hereinafter - "other mortality".
Below are the main results of our analysis [4] .
Table 1. The main mortality indicators in Russia in 1990-2002 (100,000) and alcoholic mortality rates.| 1990 | 1991 | 1992 | 1993 | 1994 | 1995 | 1996 | |
| Data of the State Statistics Committee of Russia | |||||||
| General mortality | 1116.7 | 1137.5 | 1215.6 | 1446.4 | 1566.1 | 1496.4 | 1417.7 |
| Including from: | |||||||
| alcohol poisoning | 10.8 | 11.2 | 17.6 | 30.9 | 37.8 | 29.5 | 24.0 |
| murders | 14.3 | 15.2 | 22.8 | 30.6 | 32.6 | 30.7 | 26.6 |
| suicide | 26.4 | 26.5 | 31.0 | 38.1 | 42.1 | 41.4 | 39.4 |
| other violent reasons | 82.2 | 89.3 | 101.6 | 128.3 | 138.2 | 135.0 | 119.1 |
| Cirrosis of the liver | 9.4 | 9.5 | 10.2 | 13.8 | 18.4 | 20.1 | 17.6 |
| pancreatitis | 2.8 | 2.8 | 3.2 | 4.1 | 5.1 | 4.8 | 4.6 |
| Cardiovascular diseases | 617.4 | 620.0 | 646.0 | 768.9 | 837.3 | 790.1 | 758.0 |
| other reasons | 353.4 | 365.5 | 367.6 | 435.3 | 458.5 | 448.4 | 430.7 |
| Assessment of the author | |||||||
| Alcohol mortality, 1st group | 90.5 | 95.7 | 120.8 | 168.4 | 191.8 | 175.8 | 152.7 |
| Alcohol mortality, 2nd group | 230.0 | 233.5 | 239.1 | 282.6 | 303.2 | 291.0 | 279.9 |
| General alcohol mortality | 320.5 | 329.2 | 359.9 | 450.9 | 495.0 | 466.7 | 432.6 |
| The same in % of total mortality | 28.8 | 29.0 | 30.2 | 31.4 | 31.9 | 31.4 | 30.7 |
| General alcohol losses (in thousands of people) | 474.0 | 488.0 | 534.0 | 668.0 | 732.0 | 690.0 | 638.0 |
| 1997 | 1998 | 1999 | 2000 | 2001 | 2002 | |
| Data of the State Statistics Committee of Russia | ||||||
| General mortality | 1376.0 | 1361.1 | 1472.4 | 1535.1 | 1564.4 | 1630 |
| Including from: | ||||||
| alcohol poisoning | 19.1 | 17.8 | 20.5 | 25.7 | 28.5 | 31.2 |
| murders | 23.9 | 23.0 | 26.2 | 28.3 | 29.8 | 30.9 |
| suicide | 37.6 | 35.4 | 39.3 | 39.3 | 39.7 | 38.6 |
| other violent reasons | 107.1 | 111.3 | 120.1 | 126.6 | 132.1 | 136.1 |
| Cirrosis of the liver | 15.3 | 14.4 | 15.8 | 18.0 | 20.9 | 25.0 |
| pancreatitis | 4.4 | 4.4 | 4.7 | 5.3 | 5.9 | 6.6 |
| Cardiovascular diseases | 751.1 | 748.8 | 815.7 | 849.4 | 869.4 | 913.0 |
| other reasons | 421.5 | 404.9 | 427.7 | 447.4 | 433.7 | 446.5 |
| Assessment of the author | ||||||
| Alcohol mortality, 1st group | 133.9 | 131.8 | 146.0 | 161.3 | 172.4 | - |
| Alcohol mortality, 2nd group | 276.7 | 272.3 | 293.1 | 305.0 | 305.8 | - |
| General alcohol mortality | 410.7 | 404.1 | 439.0 | 466.4 | 478.2 | - |
| The same in % of total mortality | 30.0 | 29.9 | 30.1 | 30.5 | 30.9 | - |
| General alcohol losses (in thousands of people) | 603.0 | 592.0 | 642.0 | 679.0 | 692.0 | |
As estimates and calculations show, 72.2% of murders, 67.6% of deaths from liver cirrhosis, 60.1% from pancreatitis, 42.1% from suicide, 23.2% from cardiovascular diseases are shown.
In absolute terms, the most large number of deaths with a relatively small alcohol component (cardiovascular and “other” mortality, 23.2% and 25.0%), they also account for the largest share in total mortality (54.3% and 30.0%). In contrast to this death, more rigidly related to alcohol consumption, relatively small and make up a small part of the total mortality: from 0.3% (pancreatitis) to 8.3% ("other" injuries, poisoning and accidents). According to official statistics in 1990-2001, an average of 1.6% of total mortality fell on alcohol poisoning.
This difference between the components of general and alcohol mortality requires caution in assessments due to the fact that even small errors or incoming factors when determining the share of alcohol mortality for large grades of deaths can make these errors large when summing. Therefore, in Table 1, the summation was carried out separately for deaths, whose share associated with mortality alcohol, more than 40% (1st group: alcohol poisoning, murders, suicide, “other” violent deaths, cirrhosis of the liver and pancreatitis) and below 26% (2nd group-cardiovascular and “other” deaths).
If you then combine the results of calculations performed separately for the first and second groups, and evaluate the total losses from alcoholic mortality in thousands for each year, as done in the last line of the table. 1, and then summarize this line, we will get that over 12 years (1990-2001), the direct and indirect alcoholic losses of the countries exceeded 7 million people, and from 400 to 700 thousand were ahead of schedule prematurely due to alcohol.
Calculations show that:
- A change in alcohol consumption per 1 liter per person per year changes the total mortality by 3.9%;
- A change in alcohol consumption by 1% changes total mortality by 0.5%.
In 2001, 0.5% of total mortality corresponded to 11 thousand people. From this it is followed that even a small, by 5-10% decrease in alcohol consumption will save the lives of 100-200 thousand people a year.
Mortality is most closely related to alcohol from west to east and from south to north
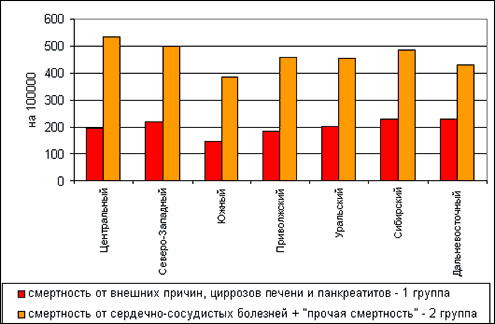
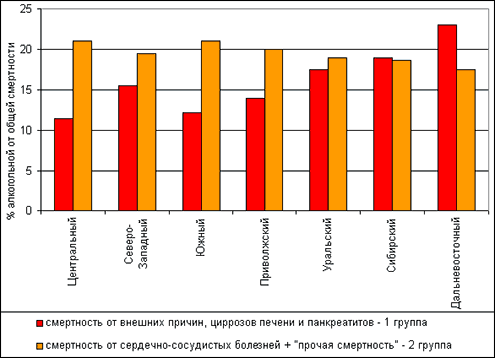
Alcohol mortality is high in all regions of Russia, but still there are considerable differences between them. In Fig. 3 presents average mortality indicators from two groups of causes in federal districts in 1990-2001. Average, in addition to greater clarity, leverage some inaccuracies in the accounting of annual indicators.
Figure 3. Alcohol mortality of two classes in the federal districts of Russia in 1990-2001 (per 100,000 population)The alcohol mortality of the 2nd group in almost all areas prevails over the mortality rate of the 1st group, especially in the Central Federal District. At the same time, the alcohol mortality of the 2nd group decreases in the direction of the West-east, respectively, a decrease in mortality during cardiovascular and "other" pathology. Such a geographical distribution of alcoholic mortality of the 2nd group corresponds to the younger age of the inhabitants of the eastern regions of the country and, accordingly, the older - in the West. When considering all constituent entities of the Federation, the correlation of the 1st alcoholic mortality group with the age of the residents of the regions is negative, the total mortality associated with alcohol is positive.
From this it follows that the total alcohol mortality, especially its 2nd group, along with the level of alcohol consumption, reflects the age composition of the population of different regions. This, however, does not mean that this group of deaths ceases to be alcohol. Moreover, she shows that in Russia the consumption of alcohol for elderly people continues to be very high. Since the elderly especially in the European part of Russia, the 2nd mortality group of these cohorts of the population is especially large in the western half of the country.
The 1st group of alcoholic deaths in a more “pure” form reflects the severity of alcoholic problems in the regions, in any case, regardless of the age of the population. According to this indicator, the Siberian and Far Eastern Federal Districts dominate (Fig. 3), which corresponds to a higher level of real consumption of alcohol [5] . The smallest indicators of alcoholic mortality are in the Southern Federal District, which differs significantly from all the others both in terms of mortality and in real alcohol consumption [6] . Indicators of alcohol mortality in the Central Federal District are significantly lower than in the Far Eastern, and in the Volga - lower than in the north -west and Far Eastern.
Since alcohol mortality, calculating the living (per 100,000) depends on the age composition of the population, different in different regions of the country, this indicator reflects not only the severity of the alcohol situation in one or another region, but also the share of older people whose vulnerability to drinking alcohol is increased.
This creates certain difficulties in comparing the regions. You can try to get around them by using such an indicator as the share of alcohol mortality in general mortality, i.e. The calculation of the number of dead, and not for the number of living. This assessment turned out to be more informative for our task, because Reflected the "weight" of alcohol factor among other mortality factors in the country and regions (Fig. 4).
Figure 4. Alcohol mortality of two classes (in % of the total) in the federal districts of Russia in 1990-2001General picture in Fig. 4 differs from the one that is presented in Fig. 3. Even the procedure for the ranking of federal districts by the importance of alcohol mortality is changing - this is evident from the table. 2, where the districts are located in decreasing order of this value. The worst place remains behind the Far Eastern District, but for the best, instead of the south, the central one, some regrouping also occurs inside the list.
Table 2. Range of federal districts for alcohol-dependent mortality| In terms of alcoholic mortality per 1000 population | By share of alcoholic mortality in total mortality | ||
| Rank | Federal District | Rank | Federal District |
| 1 | Far Eastern | 1 | Far Eastern |
| 2 | Siberian | 2 | Siberian |
| 3 | Northwestern | 3 | Ural |
| 4 | Ural | 4 | Northwestern |
| 5 | Central | 5 | Volga |
| 5 | Volga | 6 | South |
| 7 | South | 7 | Central |
What regions do the most severe losses
If from the level of federal districts we go to the level of regions and republics and rank alcohol mortality, and therefore the severity of alcoholic problems, these more fractional territories, then the list will lead (according to the descending) ten regions:
| Chukotsky AO | Kamchatka region |
| Republic of Tuva | Irkutsk region |
| Magadan region | Republic of Komi |
| Tyumen region | Khabarovsk Territory |
| Republic of Sakha | Sakhalin region. |
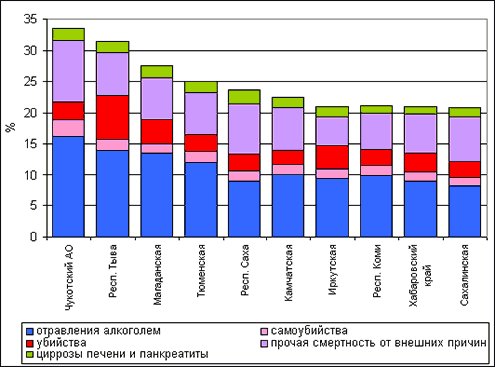
In the first four of them, the total alcohol mortality (the sum of the first and second groups of alcoholic deaths) exceeds 40% of all deaths, i.e. Almost half of the inhabitants dies in connection with alcohol ahead of schedule, allotted to them in accordance with their biological characteristics.
In all these areas of death, the 1st group prevail over the 2nd. The components of the 1st group of deaths of the leading regions are presented in Fig. 5. Almost half of this mortality is determined by alcohol poisoning. In the Republic of Tuva, this indicator is possible higher, because He was not subjected to correction - this region was among those five where the incidence of alcoholic psychoses was lower than death with alcohol poisoning, i.e. It was taken into account very badly. There was also the highest share of murders associated with alcohol.
Figure 5. The composition of alcohol mortality in ten regions of Russia leading in this indicatorIt is noteworthy that out of 10 leading regions, six are located in the Far Eastern Federal District, where the highest real alcohol consumption [7] . At the same time, of course, it is necessary to take into account the outflow of the population to the central and southern regions of the country: between the two censuses (1989 and 2002), 16% of residents left the Far East. Most likely, more active left, and among the remaining there were many drunkards and alcoholics who are more difficult to move to a new place of residence. Thus, these people increased the alcohol mortality of the region. However, most likely, this is not the main cause of the severity of alcohol mortality in the Far East.
Approximately at the same high level, alcohol mortality in five regions out of 11 in the Siberian Federal District (Republic of Tyva and Buryatia, Irkutsk and Chita Regions, Krasnoyarsk Territory). Without a special and aimed analysis, it is difficult to say why in the Novosibirsk and Omsk regions mortality is significantly lower than, for example, in the Irkutsk and Chita Siberian Federal District, which generally occupies second place after the Far Eastern.
Alcohol mortality at the level of the latter was observed only in four regions of other federal districts: Tyumen in Ural, Udmurtia in the Volga region and the Murmansk region and the Komi Republic in the north-west.
There is no special sense in special areas among the rest, since their difference in alcohol mortality fluctuates in very small limits: from 36.7% (Kalmykia) to 30.3% (Voronezh region). Moreover, the indicators of the latter in this series of 4 territories (Voronezh, Kursk and Rostov regions, the Republic of Mordovia) are most likely underestimated or, more accurately, - are not very reliable due to the high instability of annual indicators.
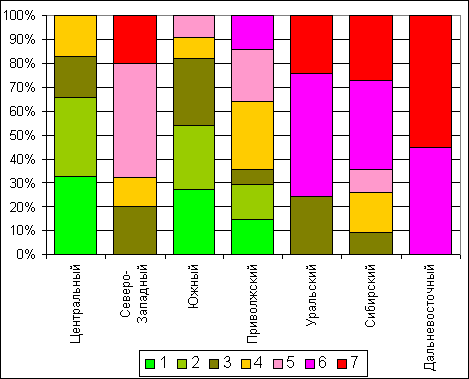
To represent the severity of alcoholic mortality problems in federal districts, you can divide the sequence of regions into 7 classes, having assigned a score 7 to the first 11 regions, the score is next 11, etc. The last 11 regions received a score 1. Naturally, according to the average score, federal districts are built into the sequence indicated above.
In general, the scatter of alcoholic mortality indicators for regional and injectors of the Federation is relatively small, from 46% to 30%. Alcohol mortality in most regions (in 50 out of 77 or 65%) is 30-34% of total mortality. In other words, the very severe consequences of alcohol consumption are relatively evenly distributed for the most part of the country. But it is also important that the most severe results of drunkenness, and therefore the drunkenness itself, are localized in the vast expanses of the Asian part and in the north of the country (Fig. 6).
Figure 6. Alcohol mortality in the federal districts of Russia (1990-2001) Note: The severity of alcoholic mortality is indicated from 1 (the smallest) to 7 (the largest). Each federal district shows the share of regions of different severity.A small scatter of alcoholic mortality indicators is a reflection of relatively small differences in alcohol consumption in different regions of the country. Ready to date, both official and evaluative data are absent. However, before the anti -alcohol campaign (1984), real consumption ranged from 12.7 liters per person per year in the southern regions to 16.7 liters in the Far Eastern region (1: 1.31). At the end of the campaign, in 1990, consumption was lower, respectively, from 10.7 to 13.3 liters [8] , and the ratio was almost the same (1: 1.24). This means that the difference in consumption was even less than the difference in alcohol mortality.
Alcohol mortality: Russia against other countries
To assess the scale of alcoholic mortality in Russia, it is possible to compare Russian data on alcohol mortality rate (33.8%) with similar indicators in the USA [9] and nine European countries [10] .
American data is quite comparable to Russian, as they take into account both direct and indirect alcoholic losses. In 1989, alcohol mortality was in the United States 5% of all deaths in the country. Over the previous 10 years, alcohol mortality in the United States decreased by 10%, and over the next six another 11% and amounted to 4.4% with a consumption of 6.6 liters of pure alcohol per person per year [11] .
Ramshtedt examined alcohol mortality in European countries, where the diagnosis of such mortality is made much better than ours. In his work, he took into account only direct alcoholic losses, but its list also included all somatic diseases associated with alcohol. One might think that some small part of indirect losses in this work is not taken into account, but the results are close to the assessment of complete alcoholic losses in the USA, where, however, consumption is slightly lower than in Europe. Given these features of Ramshtedt’s data, they can be compared with Russian (Fig. 7; Russian indicators are leaded to mortality from the age of 15, as in the work of Ramshtedt): the indicator for Russia is 32.0%, for the following Finland with the highest indicator in Europe - 3.7%. To believe that these results are close to reality, data on the expected life expectancy of men in Russia (59 years), in European countries (74-77 years), as well as in the USA (74 years), helps: the difference is 15-18 years, i.e. Almost a third of the life of Russian men.
Figure 7. Alcohol mortality in Russia and in 10 countries of Europe in 1995Differences in alcohol mortality in Russia and European countries are due not only, but perhaps not so much the difference in average per capita consumption as the difference in the quality of life, including the quality of medical care, nutrition and much more that protects against the toxic effects of alcohol. For this difference, the additional toxicity of illegal alcoholic beverages is important, a very large proportion of vodka in consumption, as well as adverse features of the genetic nature of the Russian population, unlike European [12] .
However, taking into account these arrival circumstances cannot justify the terrifying alcohol mortality in Russia. Perhaps these conditions are better, and the genetics of the Russian population is akin to European, alcohol mortality in Russia would be lower. But we have what we have: dysfunctional genetic characteristics, low quality of medical care, poor nutrition and our unworthy of the quality of life, and with them a very high level of alcohol mortality.
Notes
[1] Tishuk E.A. Medical and statistical aspects of alcohol as a cause of mortality. Healthcare of the Russian Federation 1997; 2: 34-36. The work investigated the causes of the mortality of the population of Kursk in 1991.
[2] Nemtsov A.V. Alcohol mortality in Russia, 1980-90s. M., 2001.
[3] Ibid.
[4] You can get acquainted with the analysis in the book: Nemtsov A.V. Alcoholic damage to the regions of Russia. NALEX, M.: 2003. (Make Link on "Read Books")
[5] NEMTSOV AV Drug and Alcohol Dependens 2000; 58: 133-142.
[6] Ibid.
[7] NEMTSOV AV Drug and Alcohol Dependens 2000; 58: 133-142
[8] NEMTSOV AV Drug and Alcohol Dependens 2000; 58: 133-142
[9] Stinson FS, Dufour MC, Steffens Ra, Debakey SF Alcohol Health & Research World, 1993, 17; Mcginnis J., Foege Wh Procedings of the Association of American Phusicians. 1999, 111: 251-260.
[10] Ramstedt European Journal of Population, 2002, 18: 307-323.
[11] Mcginnis and Foege, Op. CIT.
[12] Ogurtsov, PP, Garmash, IV, Miandina, Gi, Guschin, Ae, Itkes, AV, Moiseev, VS Adding Biol. 2001, 6: 377-383.