
Translated material
Average or still median?
The costs of the most popular statistical parameter is perhaps the most popular statistical parameter (hereinafter - the average). This concept is used everywhere - starting from the saying “average temperature in the hospital” and ending with serious scientific works. However, oddly enough, the average meaning is an insidious concept, often misleading, instead of giving clarity to the presentation and making clarity.
If we talk about scientific work, then a statistical analysis of data is used in almost all applied sciences, even in humanitarian (for example, psychology). The average value is calculated for signs measured in the so -called continuous scales. Such signs are, for example, the concentration of substances in the blood serum, height, weight, age. The arithmetic average can be easily calculated, and this is taught in high school. However, (in accordance with the provisions of mathematical statistics), the average value is an adequate measure of the central trend in the sample only in the case of a normal (Gaussian) distribution of the sign (Fig. 1).
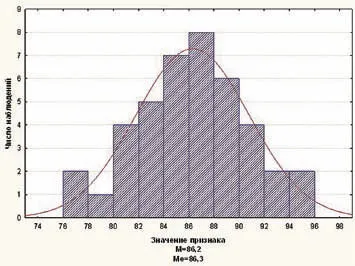
In the case of deviation of the distribution from normal law, the average value is incorrectly used, since it is too sensitive to the so -called “emissions” - uncharacteristic for the sample studied, too large or too small (Fig. 2). In this case, another parameter should be used to characterize the central trend in the sample - the median. Median is the value of the sign, on the right and left of which there is an equal number of observations (50%each). This parameter (unlike the average value) is resistant to "emissions". We also note that the median can be used in the case of normal distribution - in this case, the median coincides with the average value.
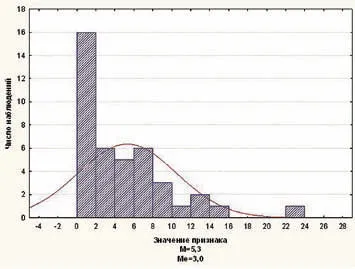
In order to find out whether the distribution of the sign in the sample is normal (Gaussian) or not, i.e. In order to find out which of the parameters should be used (average value or median), there are special statistical tests.
Let us give an example. The rate of settlement of red blood cells in a group of patients who recently suffered pneumonia - 3, 5, 5, 7, 11, 12, 16, 16, 16, 16, 42, 58. The average value for this sample is 17.8, median - 12. Distribution (according to the Shapiro -Uylka test) is not normal (Fig. 3), therefore, the median must be used.
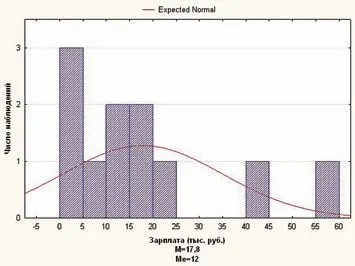
Oddly enough, in some areas of the economy, an outside observer cannot notice at least some trace of the correct use of mathematical statistics. So, they constantly tell us about the average salary (for example, at the Research Institute), and these numbers usually surprise not only ordinary employees, but also the heads of units (now called "middle -level managers"). We are surprised that the average salary in Moscow is 40 thousand rubles, but, of course, we understand that we were “averaged” with the oligarchs. Here is an example from the life of scientists: salaries of laboratory staff (thousand rubles) - 3, 5, 5, 7, 11, 12, 16, 16, 21, 42, 58. The average value is 17.8, median - 12. Agree that these are different numbers!
Of course, it cannot be excluded that the silence of the properties of the average is cunning, since it is always more profitable for the management to present the situation with the salary of employees better than it really is.
Isn't it time for the scientific community to call our leaders to stop the incorrect use of mathematical statistics?
Olga Rebrova,
doct. honey. sciences, vice president
MOO "Society of Proceedings of Evidence Medicine"