
Translated material
Elections mathematics - 2011
In the article “ Mathematics of the Election ”, published in No. 40 “Trinity Option” for October 27, 2009 [1], the statistics of the results of the federal and Moscow elections of 2007-2009 were studied. The analysis of official data from the details with details to polling stations showed that, according to these data, the share of voters who voted for the candidate of the authorities has a strong positive correlation with the turnout, unlike the shares of voters who voted for other candidates. This effect was manifested in all the elections considered, but disappeared in areas with automated calculation (Coiba equipped with scanners).
In conjunction with other circumstances (such as the peaks on the beautiful values of the turnout in the distribution of polling stations according to the turnout), this analysis made it possible to conclude that the observed increase in the turnout is higher than some average values (50-55%), and the increase in the share of the voos filed for the candidate of power are due to one mechanism-the artificial overestimation of the party for administrative pressure, the expression, and the expression and the expression and the postscribes. The article proposed a method for calculating the magnitude of this overestimation (“abnormal contribution”) on the basis of the distributions of votes over the party depending on the turnout.
The article [1] did not go unnoticed by the public, and after the recent elections to the State Duma on the Internet, many works devoted to the collection and analysis of elected data appeared. Many results were obtained independently and almost simultaneously by different people, so it is not possible to establish priority. In this article, I first briefly show the basic statistical features of the past elections, and then present the results of a comparative analysis of voting in areas with automated and non -automated votes in the country's scale. The final results of the elections in the plots at the time of preparation of the article were not available, therefore, when calculating, the data set from the site http://kartaitogov.ru , dated 23:26 December 9, 2011, the set covers 95073 polling stations and 109.055 million registered voters.
Given the past experience, according to the results of the elections, two questions should be asked. First: were there statistically noticeable falsifications and anomalies in the elections? Second: if there were - what scale they were, and is it possible to evaluate the undistorted results? This article is devoted to these issues.
Anomalies and falsification
In the current elections to the State Duma, the main anomaly of the Russian elections of past years has been preserved - different dependence on the turnout of the votes filed for the candidate of the authorities (in this case for the party "United Russia"), and a share of votes for other parties. This is clearly visible in the following diagram of the distribution of voting results in Moscow (Fig. 1):
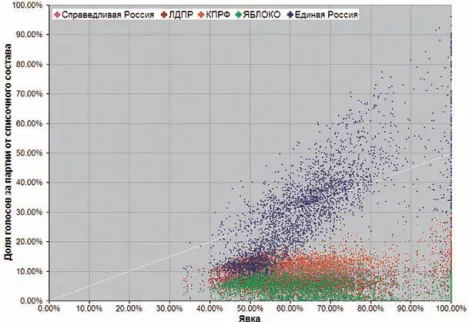
As in the elections of past years, two areas can be distinguished in this distribution. In the field of medium appearances (45-55 %) with an increase in the appearance of the share of votes for all parties grow proportionally. With higher attendance, the share of votes for United Russia is growing, and for the rest of the parties it remains unchanged and even decreases. A new trend that was not visible in the past elections is an unusual accumulation of points above the inclined line corresponding to a 50%vote for United Russia (a thin white line on the graph). We will return to this feature when discussing the distribution of plots by turnout.
The second anomaly, preserved in these elections, is an unusual distribution of polling stations by a turnout that does not meet reasonable ideas about how the appearance in the elections should look with free will, and not similar to distributions for countries that are customary to be considered as democratic. After the previous article by the author, they rightly reproached for comparing only the distribution of polling stations in the presidential election in Poland in 2006.
Now the author can offer for comparison a more extensive set of distributions of polling stations in the appearance in foreign countries (Fig. 2).
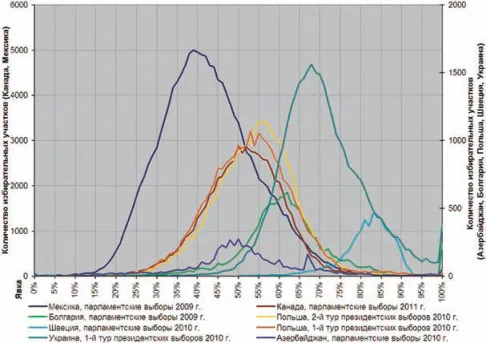
From the general row, only Azerbaijan with a powerful peak on the value of the turnout of 67% (probably 2/3) and Ukraine with an inflated right edge of the distribution are distinguished. In other countries, the distribution of plots by the turnout has a simple bell -shaped, rather symmetrical shape. A noticeable number of plots with a 100% turnout is observed in addition to the listed Azerbaijan and Ukraine only in Bulgaria.
In Russia, in the Duma elections of 2011, the distinctive tradition has been preserved: the distribution of polling stations in the turnout still looks strange.
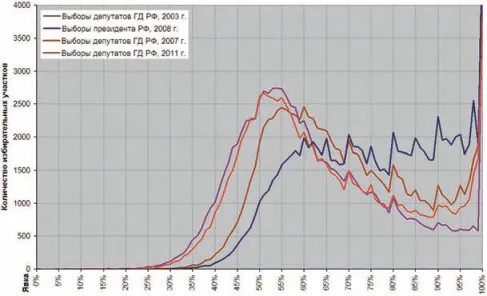
Yes, the distribution of 2011 is closer in the form to the 2003 elections than to the 2007-2008 elections-fewer sites on high turnouts, less pronounced teeth on “round” turnouts. However, the teeth of 70, 75 and 80% remained - and this means that at least some areas had falsification of the turnout.
In Moscow, the distribution of polling stations in the turnout also turned out to be interesting - two -humpye (Fig. 4).
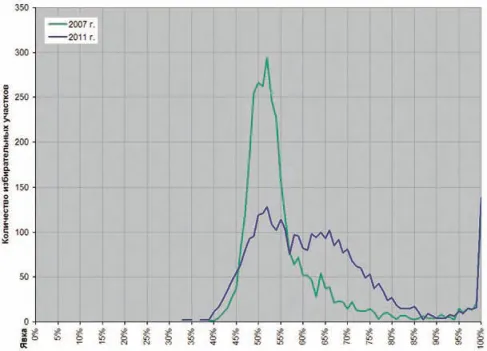
The first “Gorb” is located approximately in the same place where the maximum turnout in the 2007 elections was located - about 50 %in the turnout. The second hump, which has grown up at the distribution of plots in Moscow, is obviously associated with the upper part of the cloud of points in Fig. 1, i.e. With areas where there is an increased vote for United Russia.
Distribution of votes by turnout
The distribution of votes for the party, depending on the turnout, also look (alas!) Traditionally for the Russian elections (Fig. 5).
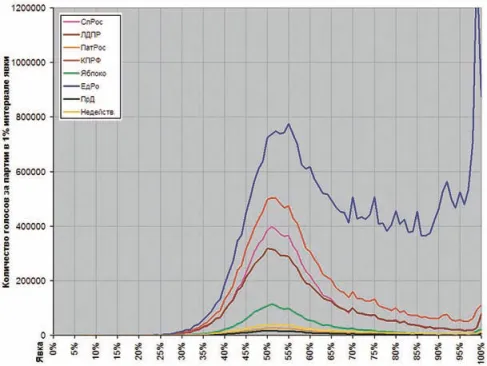
It can be seen that the voices for all parties, except EP, behave in a similar way with a change in the turnout, and the distribution of votes of EP is about 50 % of the total trend, and then deviates from it. At the same time, unlike previous elections, the ratio between the votes filed for the alternative EP of the parties significantly depend on the turnout. This is evident if you normalize the votes of the vote for all parties except EP (Fig. 6).
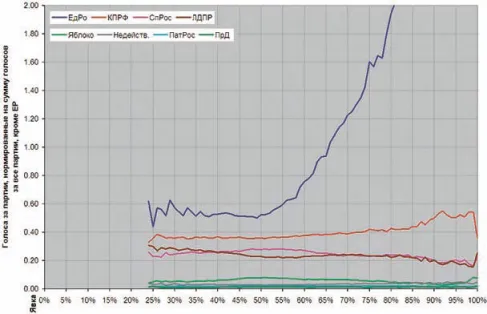
It can be seen that the share of “Fair Russia” and “Yabloko” increases among the “alternative” parties on the middle turners (50-55 %), and the share of the Communist Party of the Communist Party of the Communist Party of the Communist Party (the last effect may be the result of “painted” voting in some republics-for example, in the Vladikavkaz, the Communist Party received almost exactly 20 % in most polling stations).
As was already seen from Fig. 6, before the show of 50 %, the number of votes set behind the EP really remains a proportional number of votes for other batches. As in the last analysis, we allocate from the distribution of votes for the EP “normal” part, proportional to the sum of the votes for all the other batches, choosing an empirical coefficient in such a way that, if possible, the difference between the full distribution and the “normal” part below a certain threshold turnout (which, as can be seen from the previous graph, should be about 50%) (Fig. 7).
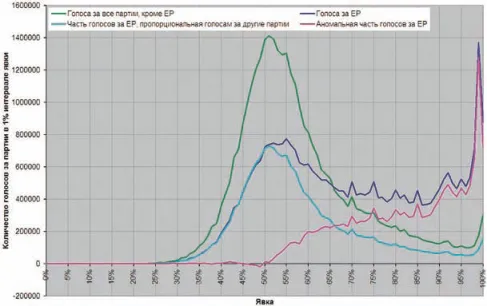
As you can see, it really succeeds in performing such a division. With this separation from the total number of 32.3 million votes for United Russia, 17.1 million turn out to be “normal”, and “anomalous” - 15.2 million (the analyzed set of voting data is unknown; according to official figures, the total number of votes over the EP is 32.4 million)
Similar procedures can be performed for voting in Moscow (Fig. 8).
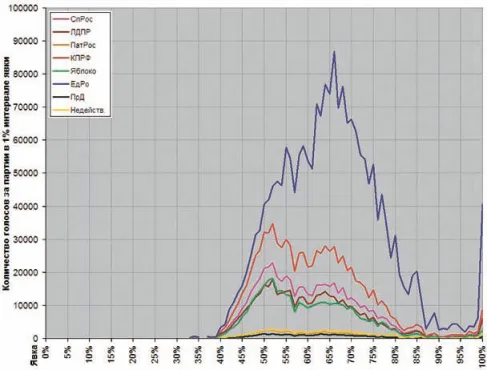
It should be noted that the distribution of votes for everything depending on the party from the turnout turned out to be two -humped as the distribution of sites, and for “United Russia” - one -humped. At the same time, the distribution of votes for all parties reaches the maximum on the first “hump”, and for the EP - on the second. This confirms that the second hump in the distribution of sites is really connected with the simultaneous overestimation of the turnout and the number of votes for “United Russia”.
Separation of votes for EP into “normal” and “abnormal” components in these conditions looks like this - Fig. 9.
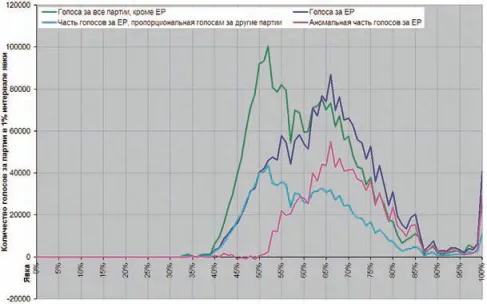
It is noteworthy that the “abnormal” component of the votes beyond the EP appears about the same turnout as for distribution throughout the country. The number of “abnormal” votes for EP with such divisions is 15.2 million throughout Russia and 1.03 million in Moscow. By excluding the “abnormal” part of the votes for the EP, you can calculate the “adjusted” results of the elections to the State Duma on December 4, 2011 (see table 1).
Table 1. Official and adjusted election results in Russia and Moscow
All of Russia | Moscow | |||||||
| Officially | With correction | Officially | With correction | |||||
| "Fair Russia" | 8679678 | 13.24% | 8679678 | 17.25% | 534458 | 12.14% | 534458 | 15.85% |
| LDPR | 7650536 | 11.67% | 7650536 | 15.21% | 416014 | 9.45% | 416014 | 12.33% |
| "Patriots of Russia" | 637779 | 0.97% | 637779 | 1.27% | 58865 | 1.34% | 58865 | 1.75% |
| Communist Party | 12574282 | 19.18% | 12574282 | 24.99% | 852033 | 19.35% | 852033 | 25.26% |
| "Apple" | 2244800 | 3.42% | 2244800 | 4.46% | 376513 | 8.55% | 376513 | 11.16% |
| "United Russia" | 32349735 | 49.34% | 17103270 | 33.99% | 2052751 | 46.62% | 1022373 | 30.31% |
| "Just business" | 391920 | 0.60% | 391920 | 0.78% | 35888 | 0.82% | 35888 | 1.06% |
| Invalid | 1031238 | 1.57% | 1031238 | 2.05% | 76511 | 1.74% | 76511 | 2.27% |
| All | 65559968 | 50313503 | 4403033 | 3372655 | ||||
| Turnout | 60.12% | 46.14% | 61.31% | 46.96% | ||||
Inhuman factor
In the last article [1], an amazing difference was demonstrated in the statistics of elections in Moscow polling stations with automatic scanners of ballots (KOIB) without them. In the current elections, the COIs of the CEC were distributed by all subjects of the Federation. In total, it was planned to establish koibi for more than 5,000 polling stations. At the same time, in Moscow, Koibov remained a quarter of the previous number (250 sites), and in St. Petersburg there were almost completely left (25 sites).
Unfortunately, there is no centralized information about the areas equipped with coibs. Information about their distribution must be sought on the websites of the election commission of the constituent entities of the Federation, but even there they are not always found. The author managed to collect lists of plots of 57 constituent entities of the Federation. Alas, it was not possible to find lists of sites for many important subjects of the Federation, for example, for the Moscow region and such prominent participants in the electoral process as Tatarstan and Bashkortostan. On the other hand, there is data on Dagestan, Chechnya, Kabardino-Balkaria, Ingushetia, Karachay-Cherkessia. Buryatia was ahead of schedule from the already assembled list, where, according to local press reports, all 41 KOIB “refused to give the results”, so they were opened and considered the ballots manually.
The result was a sample of 3282 polling stations, covering the whole country, from Primorye to the Kaliningrad region. The total number of voters registered in these sections is 5.8 million people-more than in St. Petersburg, although less than in Moscow. Great material for statistical analysis.
With what to compare these voting data on this sample? Decisions on the arrangement of Koibov in polling stations are adopted by the election commission of the constituent entities of the Federation or even a lower level. Of course, from organizational and economic considerations, Coibes are more likely to equip city plots than rural ones, and rather in the center of the subject than on the periphery (although in many subjects of the federation they were distributed according to district centers), so our sample cannot be considered representative of the country's entire population.
In addition, it does not have all the subjects of the federation. As a compromise in this article, for comparison, the results of voting were taken in all other sections of those territorial election commissions where there are sites with coils. In total, there were 16405 - 5 times more than areas with koibes. Perhaps, with a more stringent study, the basic sample should be filtered additionally - for example, by the number of voters - and apply weight coefficients depending on the share of the areas with coes in specific teas. But this is a matter of the future, but for now the first results. They are amazing.
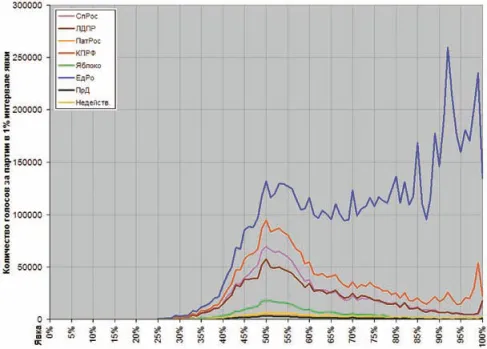
First, the results for areas with koibes (Fig. 10).
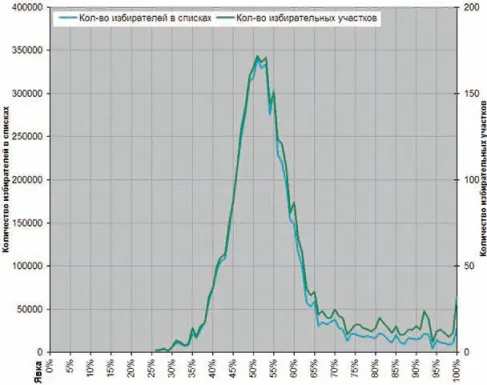
I would like to specifically note for lovers of the theory of the “special electoral culture” of the Russian provincial population: this sample includes plots in a fulf, Pocheepe, Suzemka and Trubchev-Ske, in Gorokhovts and cockerels of the Vladimir region, in the Kabardino-Balkaria, Karachay-Cherkessia and the Krasnodar Territory. The share of Muscovites in it is about the same as among all voters in the country, the share of Petersburgers is very small.
And, nevertheless, the distribution of plots on the turnout is a narrow, almost Ga Usses peak with a peak of 52% and a small “tail” on the right. It is only slightly wider than the distribution of electorals in Moscow in the Duma elections of 2007 (see Fig. 4). To match him the distribution of votes for the party depending on the turnout (Fig. 11).
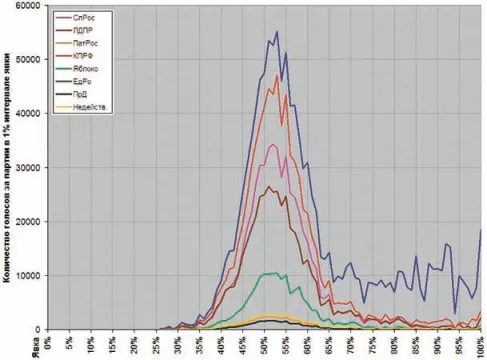
An increased share of votes behind the EP with high turnouts is present, but relatively small.
Now the results for the basic sample - polling stations without Koibov from the same territorial election commissions (Fig. 12).
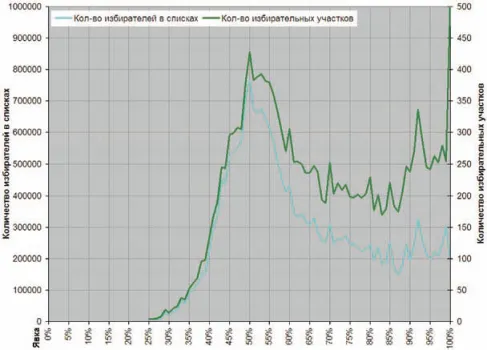
Polling stations are located in the same territories - and the distribution by the turnout is completely different. The right edge of the distribution is raised, the peaks were cut out on beautiful turnouts (Fig. 13).
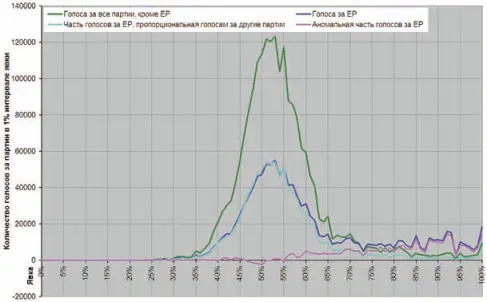
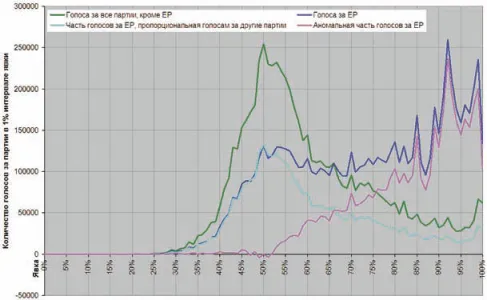
Compare with Fig. 9. In the sample of plots with the coobs, United Russia receives with increased appearance only a small increase compared to other batches. On the sample of sites without Koibov, the share of votes for EP with an increase in turnout literally takes off.
In conclusion, we will carry out the procedure for subtracting an abnormal component for two samples of sites - with coes and without coils, as was done above for the country as a whole, and calculate the appropriate election results. Naturally, absolute quantities of votes do not matter, only percentage fraction of votes for the party are significant (Fig. 14).
And finally, the voting results are the initial and adjusted (table 2).
Sample of plots with KOIB | Basic sample without koib | |||||||
Officially | Correction | Officially | Correction | |||||
"Fair Russian" | 551788 | 17.10% | 551788 | 18.72% | 1623180 | 11.68% | 1623180 | 16.76% |
LDPR | 455323 | 14.11% | 455323 | 15.45% | 1457899 | 10.49% | 1457899 | 15.05% |
"Patriotyrossia" | 40855 | 1.27% | 40855 | 1.39% | 122688 | 0.88% | 122688 | 1.27% |
Communist Party | 751383 | 23.28% | 751383 | 25.49% | 2520475 | 18.13% | 2520475 | 26.02% |
"Apple" | 167835 | 5.20% | 167835 | 5.69% | 378043 | 2.72% | 378043 | 3.90% |
"United Russia" | 1180335 | 36.57% | 900650 | 30.56% | 7528227 | 54.16% | 3313592 | 34.21% |
"Really" | 27563 | 0.85% | 27563 | 0.94% | 77915 | 0.56% | 77915 | 0.80% |
Invalid | 52184 | 1.62% | 52184 | 1.77% | 192093 | 1.38% | 192093 | 1.98% |
All | 3227266 | 2947581 | 13900520 | 9685885 | ||||
Turnout | 55.04% | 50.27% | 63.45% | 44.21% | ||||
Conclusion
An analysis of the statistics of these Duma elections in 2011 indicates that in these elections there were significant manipulations with the turnout and votes for the United Russia party. Different options for correcting the results give “United Russia” from 30.5 to 34% of the country's vote and about 30% in Moscow. For turnout, from 44 to 50% in Russia and about 47% in Moscow is obtained, respectively.
The second important conclusion of the article is the unexpected homogeneity of the appearance in the country - analysis of statistics on the sample covers the whole country from sites with KOIB does not show significant differences in the distribution of appearance from the distribution of appearance within Moscow.
1. Spilkin S.A. Statistical study of the results of the Russian elections 2007 - 2009. "Trinity Option" No. 40, October 27, 2009 http://trv-science.ru/2009/10/27/statisticheskoe-issledovanie-rezultatov-rossijskix-vyborov 2007-2009-GG
2. Shen A. Elections and statistics: the incident "United Russia" (2009). http://alexander.shen.free.fr/elections.pdf
3. A constantly updated analysis of the current elections is published on the blog of Dmitry Kobak: http://kobak.livejournal.com/102646.html#cutid1