
Translated material
"How to explore electoral falsifications?"
The beginning of the new electoral cycle of 2011-2012 was marked by the growth of protest sentiments in Russian society caused by numerous revelations of electoral falsifications. The accusations that sounded at the authorities were supported by a large number of various evidence of violations in the form of protocols, eyewitnesses of eyewitnesses and statistical analysis of electoral data.

In this article, the PHD Candidate Faculty of Political Science of the University of Michigan (Ann Arbor, USA), RASH Lecturer Kirill Kalinin talks about falsifications and basic restrictions that this kind of research faces. He also considers the effectiveness of indirect methods for assessing falsifications, namely domestic sociological surveys and existis-polles. In addition, his article refers to how to explain the “peak” falsifications of the shows or voting observed on the “round” values.
See also:
The popularization of the studies of electoral falsifications in Russia is not unique: for example, after the 2000 US presidential elections, distinguished by their ambiguity, a whole mass of articles of scientific and journalistic genres that question the official election results came out. In other words, as a rule, the formed public request for this kind of study also leads to a proposal from the expert community.
Unfortunately, modern science has not yet been invented by any ideal technique that can reveal the facts of electoral falsification, and even more so to measure their scale. Of course, if such a technique had been invented, then it would certainly become the object of attention of falsifiers and their response actions for its devaluation. Therefore, the study of electoral falsifications is always a game of ahead of the activities of “falsifiers”. If the “falsifiers” are ahead of researchers, then the latter can only be disappointed with their hands.
Suppose, in relation to Russia, the centralized collection and processing of electoral statistics using the GAS “Elections” system can contribute not only to the rapid obtaining electoral statistics, but also to coordinating efforts to manipulate electoral statistics. Suppose, in the case of the presence of such coordination, numerous methods of detecting falsification will be ineffective.
The main problem of the falsification study is precisely that it is difficult to identify and prove falsification in itself: not all observed statistical anomalies can only be reduced to falsification explanation. Next, I will dwell on two methods of studying electoral falsifications: analysis of electoral statistics and statistical data collected during field experiments, surveys and ec-regulations.
Analysis of electoral statistics data
Graphs of one -dimensional distributions
When analyzing the data of electoral statistics, many bloggers on their sites and blogs evaluate the presence and scale of electoral falsifications, building graphs of one-dimensional distributions (in other words, histograms) for appearance and voting. Moreover, they proceed from the fact that empirical data must be described using a “normal” Gaussian distribution, which, indeed in this dimension, is considered a reference, although not one of a kind.
Thus, the detection of any discrepancies between the Gaussian “normal” distribution and the observed distribution, from their point of view, indicate the obvious presence of electoral falsifications. For turnout, this assumption is usually believable (for example, in the same Mexico, Poland, Bulgaria, similar distributions are observed) (see schedule 1A). However, when constructing such voting schedules, normal distribution is usually absent (see schedule 1b).
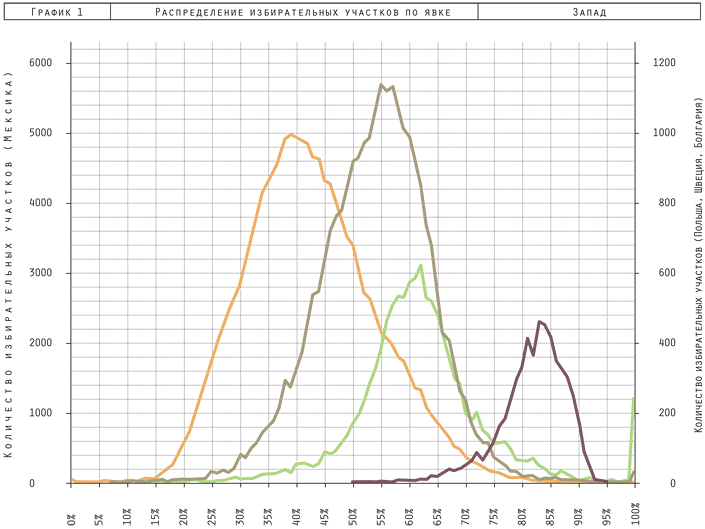
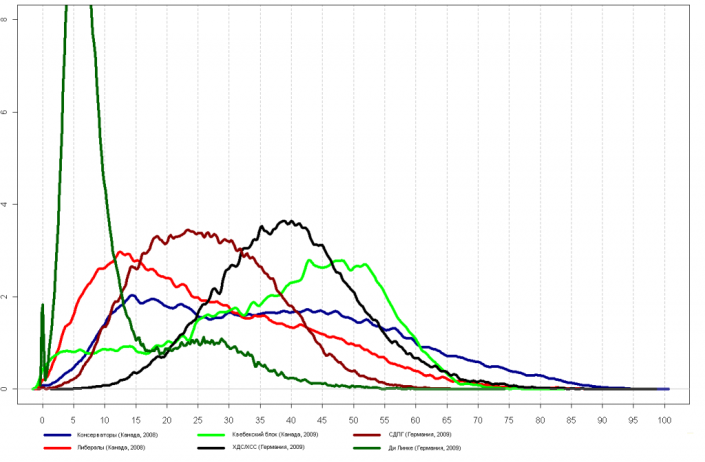
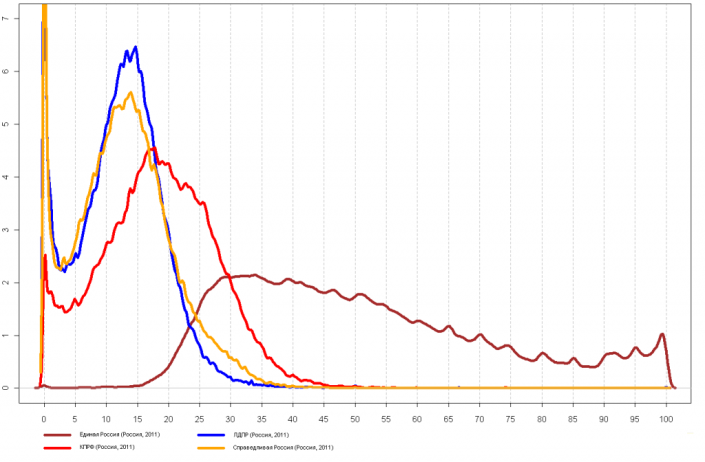
As a rule, one -dimensional graphs exclude from the consideration many factors that could explain the observed anomalies: the belonging of plots to regions or republics, cities or villages, etc. In other words, the use of one -dimensional distributions ignores the multidimensional nature of the data, entering them only in one dimension.
This problem resembles one plot from Flutland E. Ebbotta , according to which the sphere, passing through two -dimensional space, seemed to its inhabitants in the form of a circle that changed its size. Speaking more definitely, the existence of plots with a 100 % turnout can be explained by the presence of small settlements, garrisons, prisons, hospitals. For example, when weighing the turnout by the number of voters that voted in each section of voters, most of the abnormal peak in the region of 100% turnout disappears (see graphics 2 and 3).
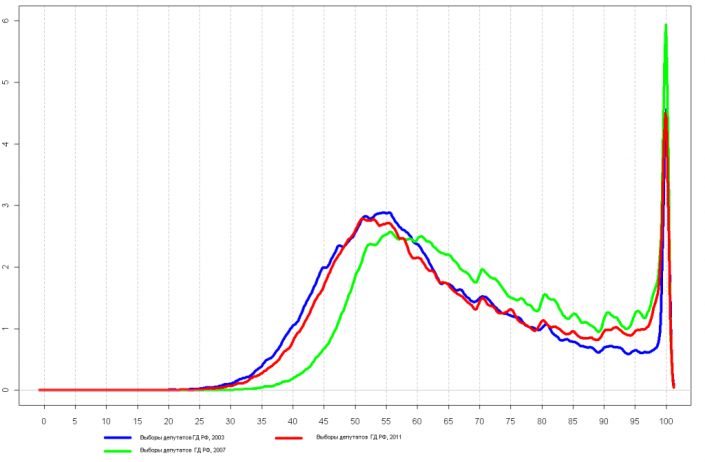
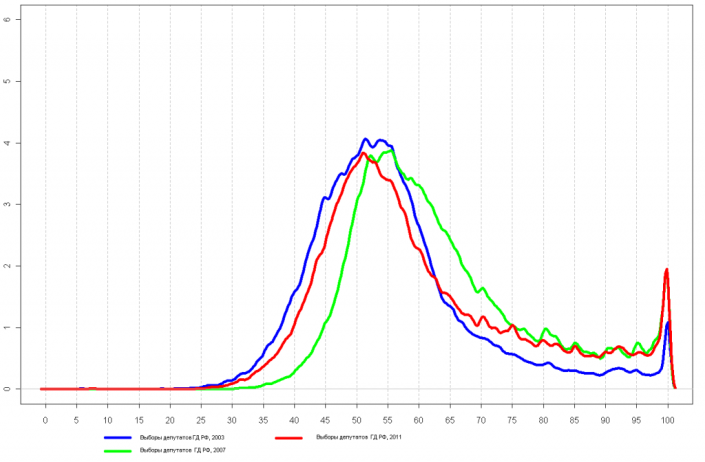
However, at the same time, in the democratic countries that we have, the peak values of the appearance are still absent.
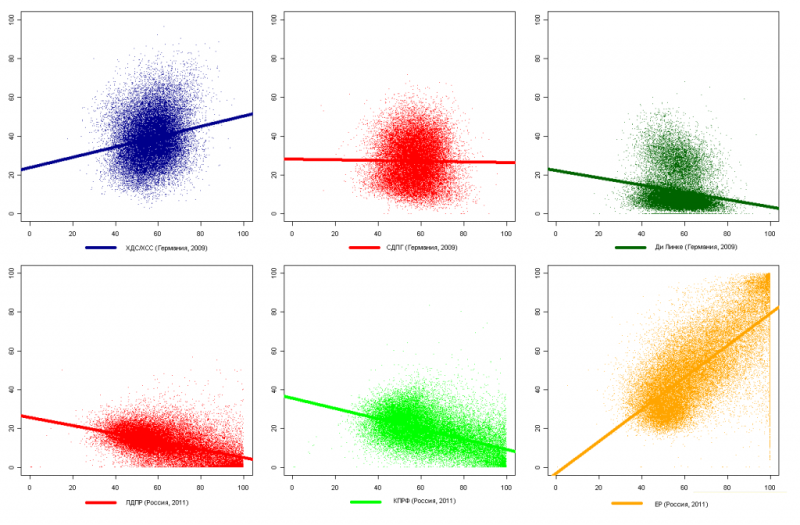
Two -dimensional graphs in another important way to identify falsifications The establishment of the relationship between the turnout and voting, which is determined by regression or correlation analysis, is used, and is visually submitted in the form of two -dimensional graphs (for the first time this kind of analysis was presented in the works of A. Sobyanin and V. Sukhovolsky, and then M. Softkov and P. Ordeshuk). The substantiation of this kind of graphs is simple: with a positive relationship between the turnout and the vote, we can talk about stuffing, and the presence of negative parties for opposition parties (see schedule 4).
Despite the seemingly impeccable nature of this method, there are a number of significant restrictions. Firstly, it is quite possible that the observed relationship between the turnout and the vote is explained by the data heterogeneity mentioned by me. This argument is confirmed by the example of other countries where similar addictions are visible. Secondly, the existence of categories of voters with different activity of participation in the elections is not excluded. Thirdly, when building regression models, the interdependence between the turnout and the vote, as a rule, leads to the wrong results of regression analysis, and requires more complex statistical models.
Distribution of numbers other methods The diagnosis of electoral falsifications takes into account the distribution of second or last significant numbers in the numbers of voting voters. For example, according to the law of Benford, the theoretical distribution of probabilities of the second meaningful figure (inverted logarithmic function) of the number should coincide with the observed distribution, if the numbers are taken from the real world. This law proven its reliability in electoral diagnosis in relation to various national contexts, however, according to recent studies by W. Furniture, the application of this method is complicated by the requirements for taking into account the specifics of the electoral system of the studied country.
The alternative approach is concentrated on the study of the latest significant numbers in the numbers of voting voters. According to him, if the numbers of voting voters reflected the totality of natural processes that encourage people to vote or rejection of voting, then the latest significant numbers in numbers should be characterized by uniform distribution. So, table 1. Shows that the distribution of the latest significant numbers in the observed numbers of voting voters from 2003 to 2012. Significantly different from uniform distribution.
Table 1. Distribution of the last significant figure in the numbers of voting voters in the federal Russian elections in 2003-2012.
2003 | 2004 | 2007 | 2008 | 2011 | 2012 | |||||||
| Number | P | ABOUT | P | ABOUT | P | ABOUT | P | ABOUT | P | ABOUT | P | ABOUT |
0 | 6.2 | 3.0 | 9.9 | 4.7 | 10.5 | 7.7 | 15.4 | 10.5 | 11.4 | 5.6 | 7.9 | 2.5 |
1 | −2.0 | 0.1 | −1.8 | 1.3 | −0.8 | 0.1 | −1.4 | −0.7 | -2.9 | -1.0 | -2.6 | 0.2 |
2 | −0.6 | −0.4 | 1.1 | 0.5 | −1.3 | 1.7 | −2.1 | −0.2 | 0.9 | -2.7 | 1.5 | -0.3 |
3 | −1.2 | −1.0 | −1.8 | −0.7 | −0.6 | −1.4 | −1.9 | −2.1 | -0.5 | -1.3 | -1.6 | -1.3 |
4 | 0.7 | −0.3 | −3.3 | −0.8 | −3.4 | −1.0 | −3.7 | −1.3 | -3.8 | 1.2 | -0.8 | -0.9 |
5 | 3.1 | 0.9 | 2.1 | 3.3 | 2.1 | −0.2 | 2.7 | 0.8 | 1.3 | 0.4 | 0.7 | 1.3 |
6 | −1.8 | −0.9 | −0.1 | 0.0 | −2.8 | −1.8 | −1.3 | −1.1 | -2.9 | 0.6 | -0.6 | -0.4 |
7 | −0.2 | 0.9 | −2.0 | −2.2 | −1.1 | −0.9 | −3.1 | 0.0 | -1.6 | 0.2 | -1.1 | 1.1 |
8 | −0.7 | −1.5 | −0.7 | −2.1 | −0.3 | −0.8 | −1.4 | −1.0 | -0.3 | -1.1 | -2.1 | -0.6 |
9 | −3.5 | −0.8 | −3.4 | −4.0 | −2.3 | −3.5 | −3.2 | −4.9 | -1.5 | -1.8 | -1.3 | -1.5 |
69.9 | 15.4 | 137.2 | 60.9 | 144.2 | 82.0 | 292.2 | 143.0 | 169.9 | 47.33 | 83.3 | 14.6 | |
n | 17.008 | 77.305 | 17,600 | 77.824 | 17.875 | 77.928 | 17.865 | 78,383 | 17732 | 77435 | 12021* | 53513* |
Table 1. The corresponding to each number, which is at the last position of the number, the iconic roots of the statistics of the chi-square, where the zero hypothesis implies the uniform distribution of the last meaningful number in the numbers of voters in the weekends. shows the total statistics of the hi-quadratic with 9 degrees of freedom, i.e. The total amount of deviations for the year, n is the total number of weekends (for p-republic, and O-registers, *-preliminary calculations, at the moment not all data are posted on the election of the election commission).
In the event that the absolute value of the tabular number is equal or exceeds 2.0, we can talk about the observed significant discrepancy, i.e. numerical anomalies. There is a very curious trend: in the numbers of voting voters (i.e., in the turnout) there is always too large the number of zeros and fives, but at the same time - a clear lack of nine. It is noteworthy that according to the total statistics of the XI-quarter , the election 2011 and 2012. turn out to be more “clean” compared, say, since 2007 and 2008.
Analysis of polls, eccip regions and field experiments.
Common to all these methods is the use of a selective method by which random selection of respondents and sites is made. An important advantage of indirect methods of measuring falsification is the ability to collect a large number of data about the respondents and areas randomly selected. The presence of such data allows you to more convincingly prove the theory/hypothesis about the presence of falsifications, or, conversely, refute it (unlike data from electoral statistics in all areas, which may not be enough to endow the anomalies with a shortage of “falsifications”). The main difficulty is the technical implementation of the accidental selection of respondents, voters or areas that ensure the representative nature of the sample, as well as the presence of a total error.
Field experiments allow you to evaluate the level of electoral falsifications, comparing the average election results on two types of randomly selected sites: sections in which specially prepared observers were able to fix serious violations and areas in which violations were not fixed. If the field experiment, implemented by the “Citizen Observer” project in the December elections of 2011, was able to establish the scale of electoral falsifications in favor of the EP in Moscow by the equal 12%, then in the March elections of this kind of large -scale falsifications it was not possible to identify: the difference between the average results in two groups of sites was 1.2%, without going beyond the limits of statistical error.
Field experiments can be influenced by various factors that reduce their accuracy. Starting with the problem of compliance with the quality of random selection of plots in Moscow (closed areas are not covered by an experiment) and the interests of the “falsifiers” themselves in concealing falsifications in the selected areas (if the numbers of selected areas are known to them in advance), and ending with the interests of the observers themselves, who can initially pursue the goals of the opposite experiment.
The indirect method of evaluating electoral falsifications, as a rule, is the election ratings and electoral forecasts based on polls conducted by domestic sociological services. Many are unsubstantially complained that talks about mass falsifications, in the whole country, contradict the data of existential regulations and polls conducted in accordance with the scientific methods of collecting and analyzing data. And vice versa, supporters of the falsification paradigm, as a rule, are accused of sociological organizations of a worst distortion of electoral statistics.
Starting from the 90s. Sociological organizations have always successfully coped with the calculations of ratings and forecasts, but at the same time a number of circumstances of sociologists complicating the work existed and continue to exist. On the one hand, we can talk about the widespread use of non -presenting samples, into which only easily accessible respondents are selected, on the other hand, the practice of rewriting the questionnaires themselves interviewers.
Finally, the most important factor, in my opinion, affects the quality of political polls, is the factor of “deceitfulness” of the respondent himself, who preferred to give a socially approved answer to the question of whom he is going to vote. For example, according to the preliminary results of a recent survey experiment, I, together with the Levada Center for the 2012 election campaign, among the voters of the gathers to take part in the elections, the share of those who, for one or another reasons, tells the lie about their true preferences in relation to one of the candidates is about 15%. Of course, this kind of distortion can partly untie the hands of “falsifiers”, striving to achieve a “so -called” result.
Finally, the ec-polons face the same problems: there are problems of random selection of sites, problems of refusals (only those respondents who agreed to take part in the exit is interviewed, but “refuseniks” are not interviewed, who may have excellent political preferences from those who agreed to take part in the surveys). The main, nevertheless, factor distorting the results of sociological surveys and exit regolov is the desire of many respondents to give socially approved answers that give a total percentage of support for the Kremlin candidates or the party in power, and an underestimated opposition.
Explanation of electoral falsifications in the presidential election 2000-2008.
The presence of peaks on the “round” values of the turnout and voting for the party of power (some bloggers in the distributions christened the “beard of Churov”), in my opinion, serves as a weighty argument in evidence of the presence or absence of falsifications. According to our analysis, the observed peaks on the "round" meanings of the appearance are statistically significant, in other words, the possibility of their accidental occurrence is excluded. I note that throughout the 2000s, Russia noted quite steady their growth precisely on the "round" values of the turnout (see graphics 2.3).
We managed to develop a theoretical explanation for this observation in Michigan together with Volter Furniture. According to our game model, the growth of political centralization of power in Russia contributed to a change in the rational strategies of the governors: if in the mid-1990s the relations between politically autonomous governors and the Kremlin were built in the form of a bargain, in which favorable electoral results exchanged for political/economic resources, then the subsequent political recentity of the 2000s prompted governors to change their strategies for signaling.
Signal strategies involve the use of falsifications on the "round" values of the turnout as a signal about the loyalty of a single governor. A similar signal is rewarded with large inter -budget transfers from the Kremlin, as well as guarantees of the political survival of governors. The main theoretical conclusions of this model were confirmed by the results of the analysis of the empirical data of the presidential election 1996, 2000, 2004 and 2008.
Resume
The study of electoral falsifications is a laborious procedure that implies the development of data analysis methods and the construction of explanatory theories of electoral falsifications. Its successful scientific implementation is impossible without the consistent exclusion of alternative explanations for the observed statistical anomalies. Until the “anomalies” went through these millstones of the scientific method, it is difficult to talk about any scientific validity of electoral falsifications.
An analysis of the data of electoral statistics is usually limited by the lack of information about abnormal areas to test alternative hypotheses. Indirect methods of evidence of falsifications, as a rule, come to their aid, but they have their own difficulties in realization, including those associated with the unwillingness of most respondents to reveal their true electoral preferences.