Translated material
Hunger Map - World Hunger Map
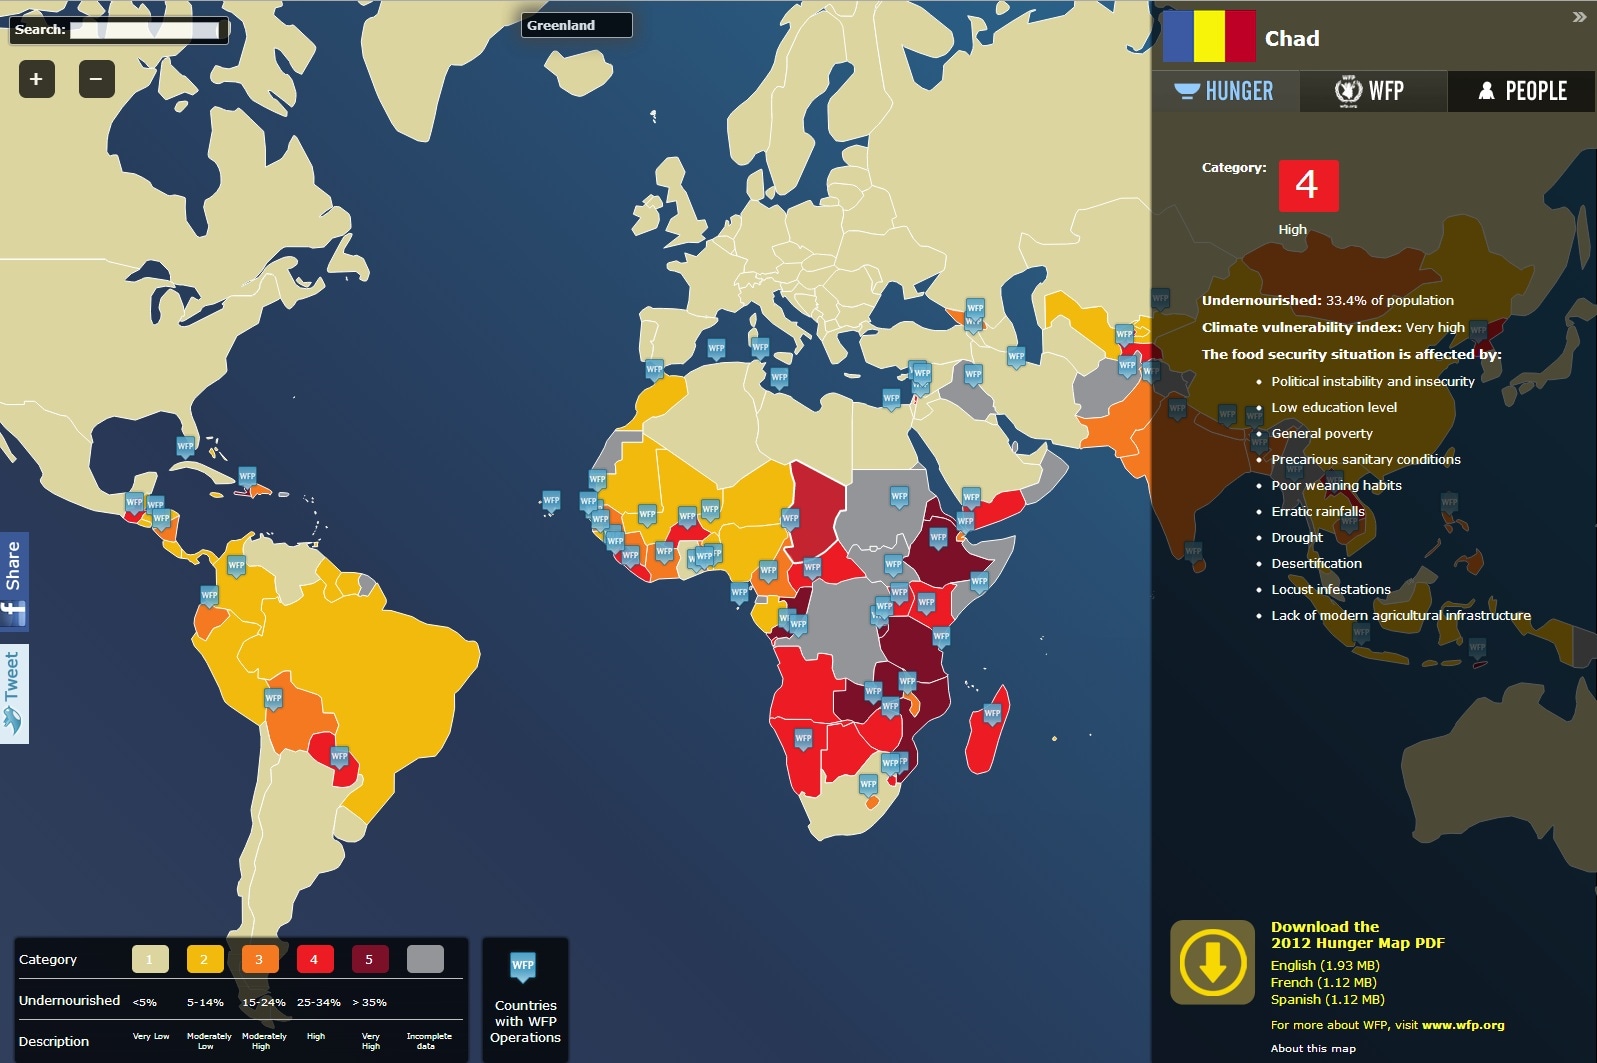
Every day 1 out of 8 inhabitants of the Earth goes to bed hungry. The consequences of hunger are destructive not only in the current period, they can threaten the future of the country. Hunger Map (Hunger map) is an excursion into today's situation and an interactive reference book in the areas of the organization.
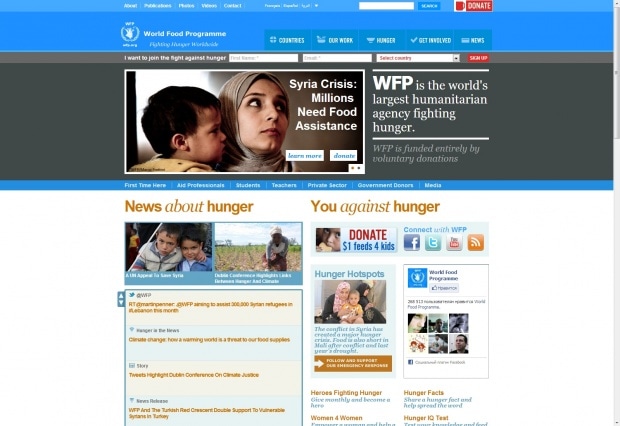
The World Food Program (VPP) is the world's largest humanitarian organization. Being founded in 1961, it became an integral part of the UN structure and provided assistance to more than 70 developing countries around the world. The organization’s activities are financed by governments, corporations and ordinary donors of the received funds are enough to provide about 4 million food products annually.
Behind the shoulders of the runway are vast experience. The map of its representative office includes the most problematic regions, where the share of the starving population is approaching a 50 percent grade. The organization provides support both with natural disasters and internal shocks, and in peacetime for the implementation of the general humanitarian program. Three stages of operational measures used in the case of an emergency are presented on infographics . It can be seen from it that the actions of the runway always are strategic in nature and are aimed at the long -term perspective.
The consequences of hunger are extremely destructive: this is evidenced not only by death indicators of hunger directly affects the country's intellectual potential, its gene pool. Each country has its own set of factors that determine the development of a food problem. The general factors include climatic conditions, economic growth, political stability, but there are a number of individual reasons inherent in a particular country. All of them are presented on the “Hunger map”, which became the expression of many years of work of the runway.
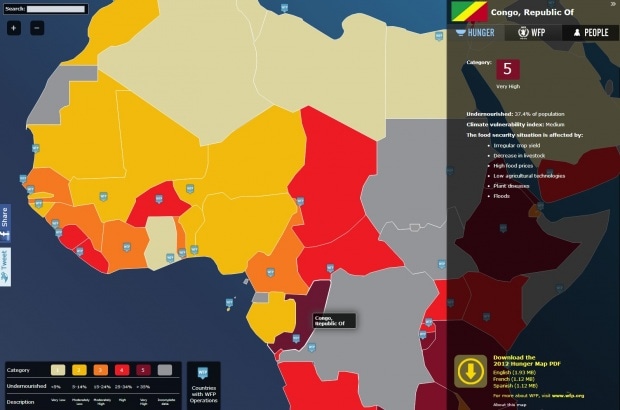
The Hunger map is available in three languages (English, Inspan, French) and is not much different in its device from cards from the school atlas. Each country is marked by color characterizing the percentage of the starving population from the total. The most dangerous red color prevails in Africa, but is also found in South America and Asia. In addition to a share for each country, a climatic index is calculated and a number of indicators are represented that reveal the activities of the runway in this country, as well as links to go to the organization’s website to the appropriate section. A set of factors that determine hunger is attached to quantitative data. For many countries, there are no data, since the runway did not conduct its activities in them. Hunger Map can be viewed in PDF format.