
Translated material
How to create a meaningful presentation and attract the reader with an interesting material

On September 6, 2016, Mitap Greenhouses of Social Technologies was held in Kazan on the topic “Infographics as a modern way of visualization of data” . Participants learned about the structure, format, content and possible forms of infographics. And also about how to make meaningful presentations and attract the reader with an interesting material.
The meeting was Boris Malakaev , an art director of the creative agency "Brainstore" .
The structure of the presentation is its skeleton on which the whole performance is held. Think carefully what will be said in the performance and what will be shown in the presentation for the audience. The performance in its structure resembles a school essay and includes the introduction, main part and conclusion.
Boris Malakaeva Council: for each slide of the presentation, no more than 30 seconds of the text should account - this is the golden mean in which the speaker does not “lose” the audience. Include navigation in the presentation structure. Navigation will help both the speaker and the audience not to get confused and navigate in a large amount of information.
How to convey the idea correctly?
All parts of the speech must be agreed and interconnected. If the text reports the necessary information to the listeners, then the presentation illustrates the performance and improves the perception of new information.
The presentation has the rule "The smaller the text, the better."
Otherwise, the audience, listening to the speaker and reading the text at the presentation itself, “falls out” from the process of obtaining information. Thus, the speaker acts through the audial channels of perception, and the presentation itself is aimed at visual channels for obtaining information and leaves peculiar “clues” in the listener's memory.
These “clues” are also created with the help of pictures in a presentation, which, in turn, should reflect the topic of performances and be high -quality and appropriate.
You can use infographics as visual content.
Infographics is a way to organize large volumes of information and clearly show the ratio of objects and facts. When creating it, you need to remember the following.
- Sample . In order for information, information is needed. Find the necessary data and structure it.
- Comparison . The received and processed data must be analyzed and dependent.
- Design . The selected and meaningful information must be beautifully designed: select one style, turn on the schemes and diagrams.

What do you need to know about the style of presentation?
The visual style of the presentation should meet the information provided, so pay attention to:
- The topic - the chosen topic accompanies the entire presentation throughout its “life”;
- Audience - the presentation must correspond to the target audience;
- Technical moments and the situation in which the performance will be held, for example, the presence of a projector, clicker, microphone, find out the screen format.
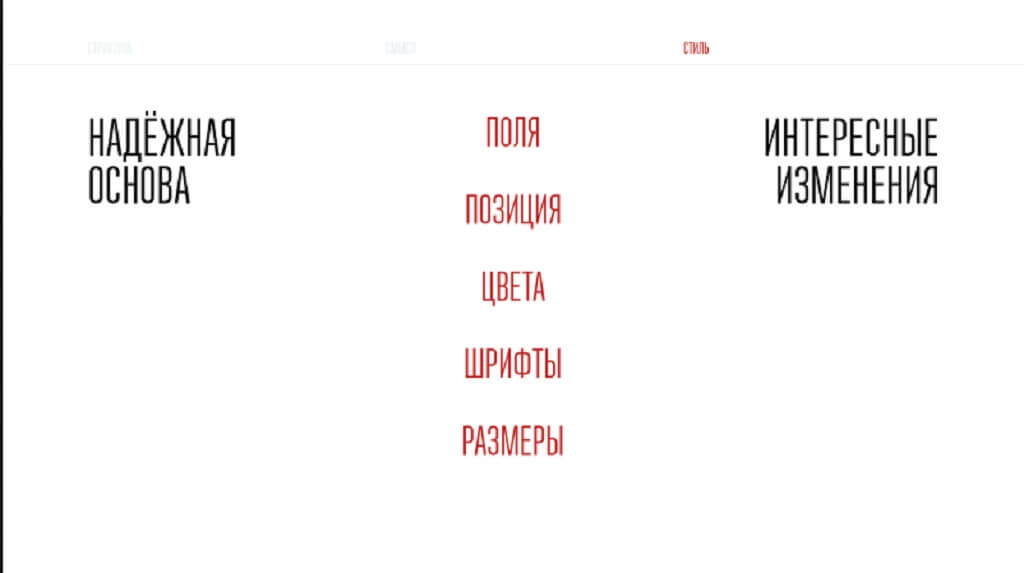
The presentation style has its own constants, which will be even more interesting if they are changed in order to strengthen the visual perception of information.
The following points when they change become a “highlight” of performances and presentations:
- fields;
- position;
- color;
- fonts;
- Dimensions.
Useful links to create a presentation
- Inspiration can be found on the Pinterest website.
- You can see the presentation templates on CreativeMarket .
- Find the necessary illustrations here: Creative Commons , Picjumbo , Imfree , Splitshire, Pixabay .
- Various fonts for the presentation can be found on parataype .
- Palette are through the Material Palette service.