
Translated material
The Data Visualism Catalogue: Data visualization library
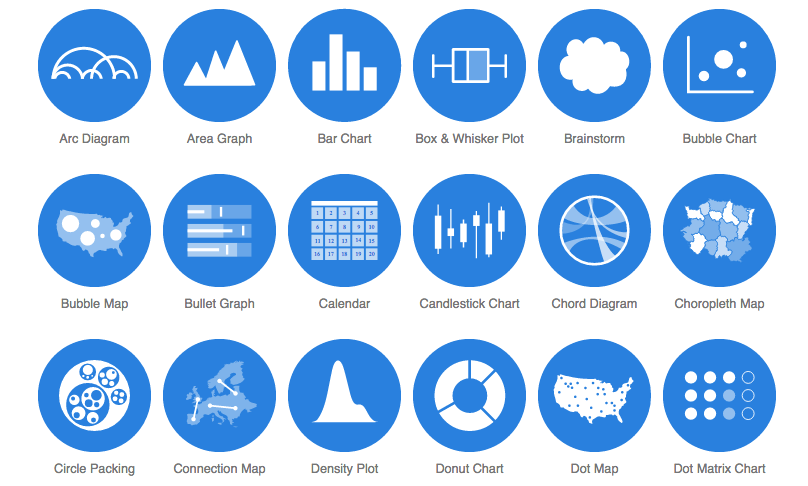
The Data Visualism Catalogue is a library of online tools for visualization. The catalog contains services for creating infographics, maps, “bubble charts”, temporary lines, working hours.
The catalog developer graphic designer Severino Ribekka combined all online visualization tools available on the network. The site presents 55 types of tools, and the base is constantly complemented.
What I liked
- The site looks simple, neat and consists of only two sections: the list (View by list) and types of graphs. Such navigation helped quickly choose the right tool. Beginning with testing the tool for creating a tag cloud.
- There is a description of the tools. I read what the “tag cloud” is, in which cases it should be used, and received several short practical tips on working with the tool. The “anatomy of the project” helps to fully understand the structure - its schematic description.
- You immediately see how your visualization will look.
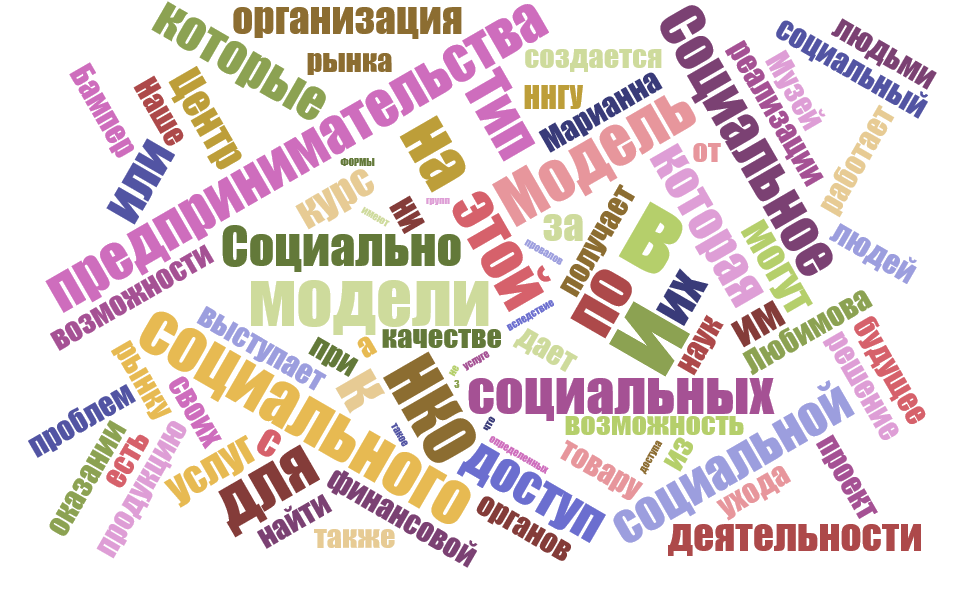
- I can choose online tools. It turned out that the “tag cloud” can be created in 9 services. There are links to everyone. I chose the D3 program (Code) . The minimum description, you just need to insert the text into the window and set the visualization parameters - how many words you need to display. I choose 100 so that the cloud does not look too bulky. 10 seconds pass, and the program gives a finished picture. The application works both with Cyrillic and Latin.
This is the cloud from the report of Mitap Greenhouse of Social Technologies on Social Entrepreneurship, which took place on September 21 in Nizhny Novgorod.
I try other programs presented in the list. For example, Wordle turned out to be inoperative, during the establishment of the text she gave an error. You need to register with Visage , The R Graph Gallery redirects me again to the D3 program, and Zingchart suggested working in the code format, which complicates the task of creating a cloud. I will dwell on D3, as it turned out to be the most understandable in use.
More on the topic: visualization. 4 online services for creating a cloud of tags and words in Russian
Of the significant advantages of the library - the fact that in the description of some types of tools there are examples of finished work.
You can offer to place an example of your project created using these services. But this service is paid.
I didn't like it
- The site and all applications are in English. This means that you need to know the language (many technical terms) or you will have to create a project, armed with a google translator. Because of this drawback, many services may seem difficult to use.
- To use some services, you need to register. This is required by tools for creating Datahero cards, Datavisual histograms. I prefer to use services that do not require registration.
- It turned out that some services, for example, an application for creating GEPHI diagrams, need to be downloaded before using them. In my opinion, this is a big minus-I would not want to download the application to test it, possibly once. It is most convenient to work online.
- There are no work examples in the description of some tools. I did not have enough example in the “Network diagram” : despite the fact that there is a small instruction, I would like to understand how the experts used this tool.
- There is no classification of applications in terms of complexity. To choose an online service for the "beginner", you will have to spend time and view all the tools offered in the catalog. There are easy services to use that can be tested without a translator.
How can you use these tools
For NGOs, online biblioteka opens a large selection of free visualization tools.
With the help of them you can create:
- reports in the form of diagrams about the work done;
- Graphs will show the growth of project donors, subscribers and volunteers.
There are still interesting options. You can develop:
- project calendar;
- desktop for employees;
- temporary line about your achievements;
- Map of the brainstorming for a future presentation.
According to the creator Severino Ribekka, the library is under development. On the site you can see that five more types of tools have not yet been added (they are highlighted in gray). The author of the project asks users to leave response and write which tools are not enough.
The news of the Data Visualism Catalogue project can be read on Twitter .