How to work with the Tableau visualization service
On October 17, 2016, with the support of Mail.ru Group, the Mitap of Social Technology greenhouses“Interactive Infographics in Tableau” took place. The meeting was performed by Vadim Shmygov , a visual journalist, lecturer of the infographic course on the Netology platform. On Mitap, the participants learned the possibilities of the platform and learned how to work with the program interface.
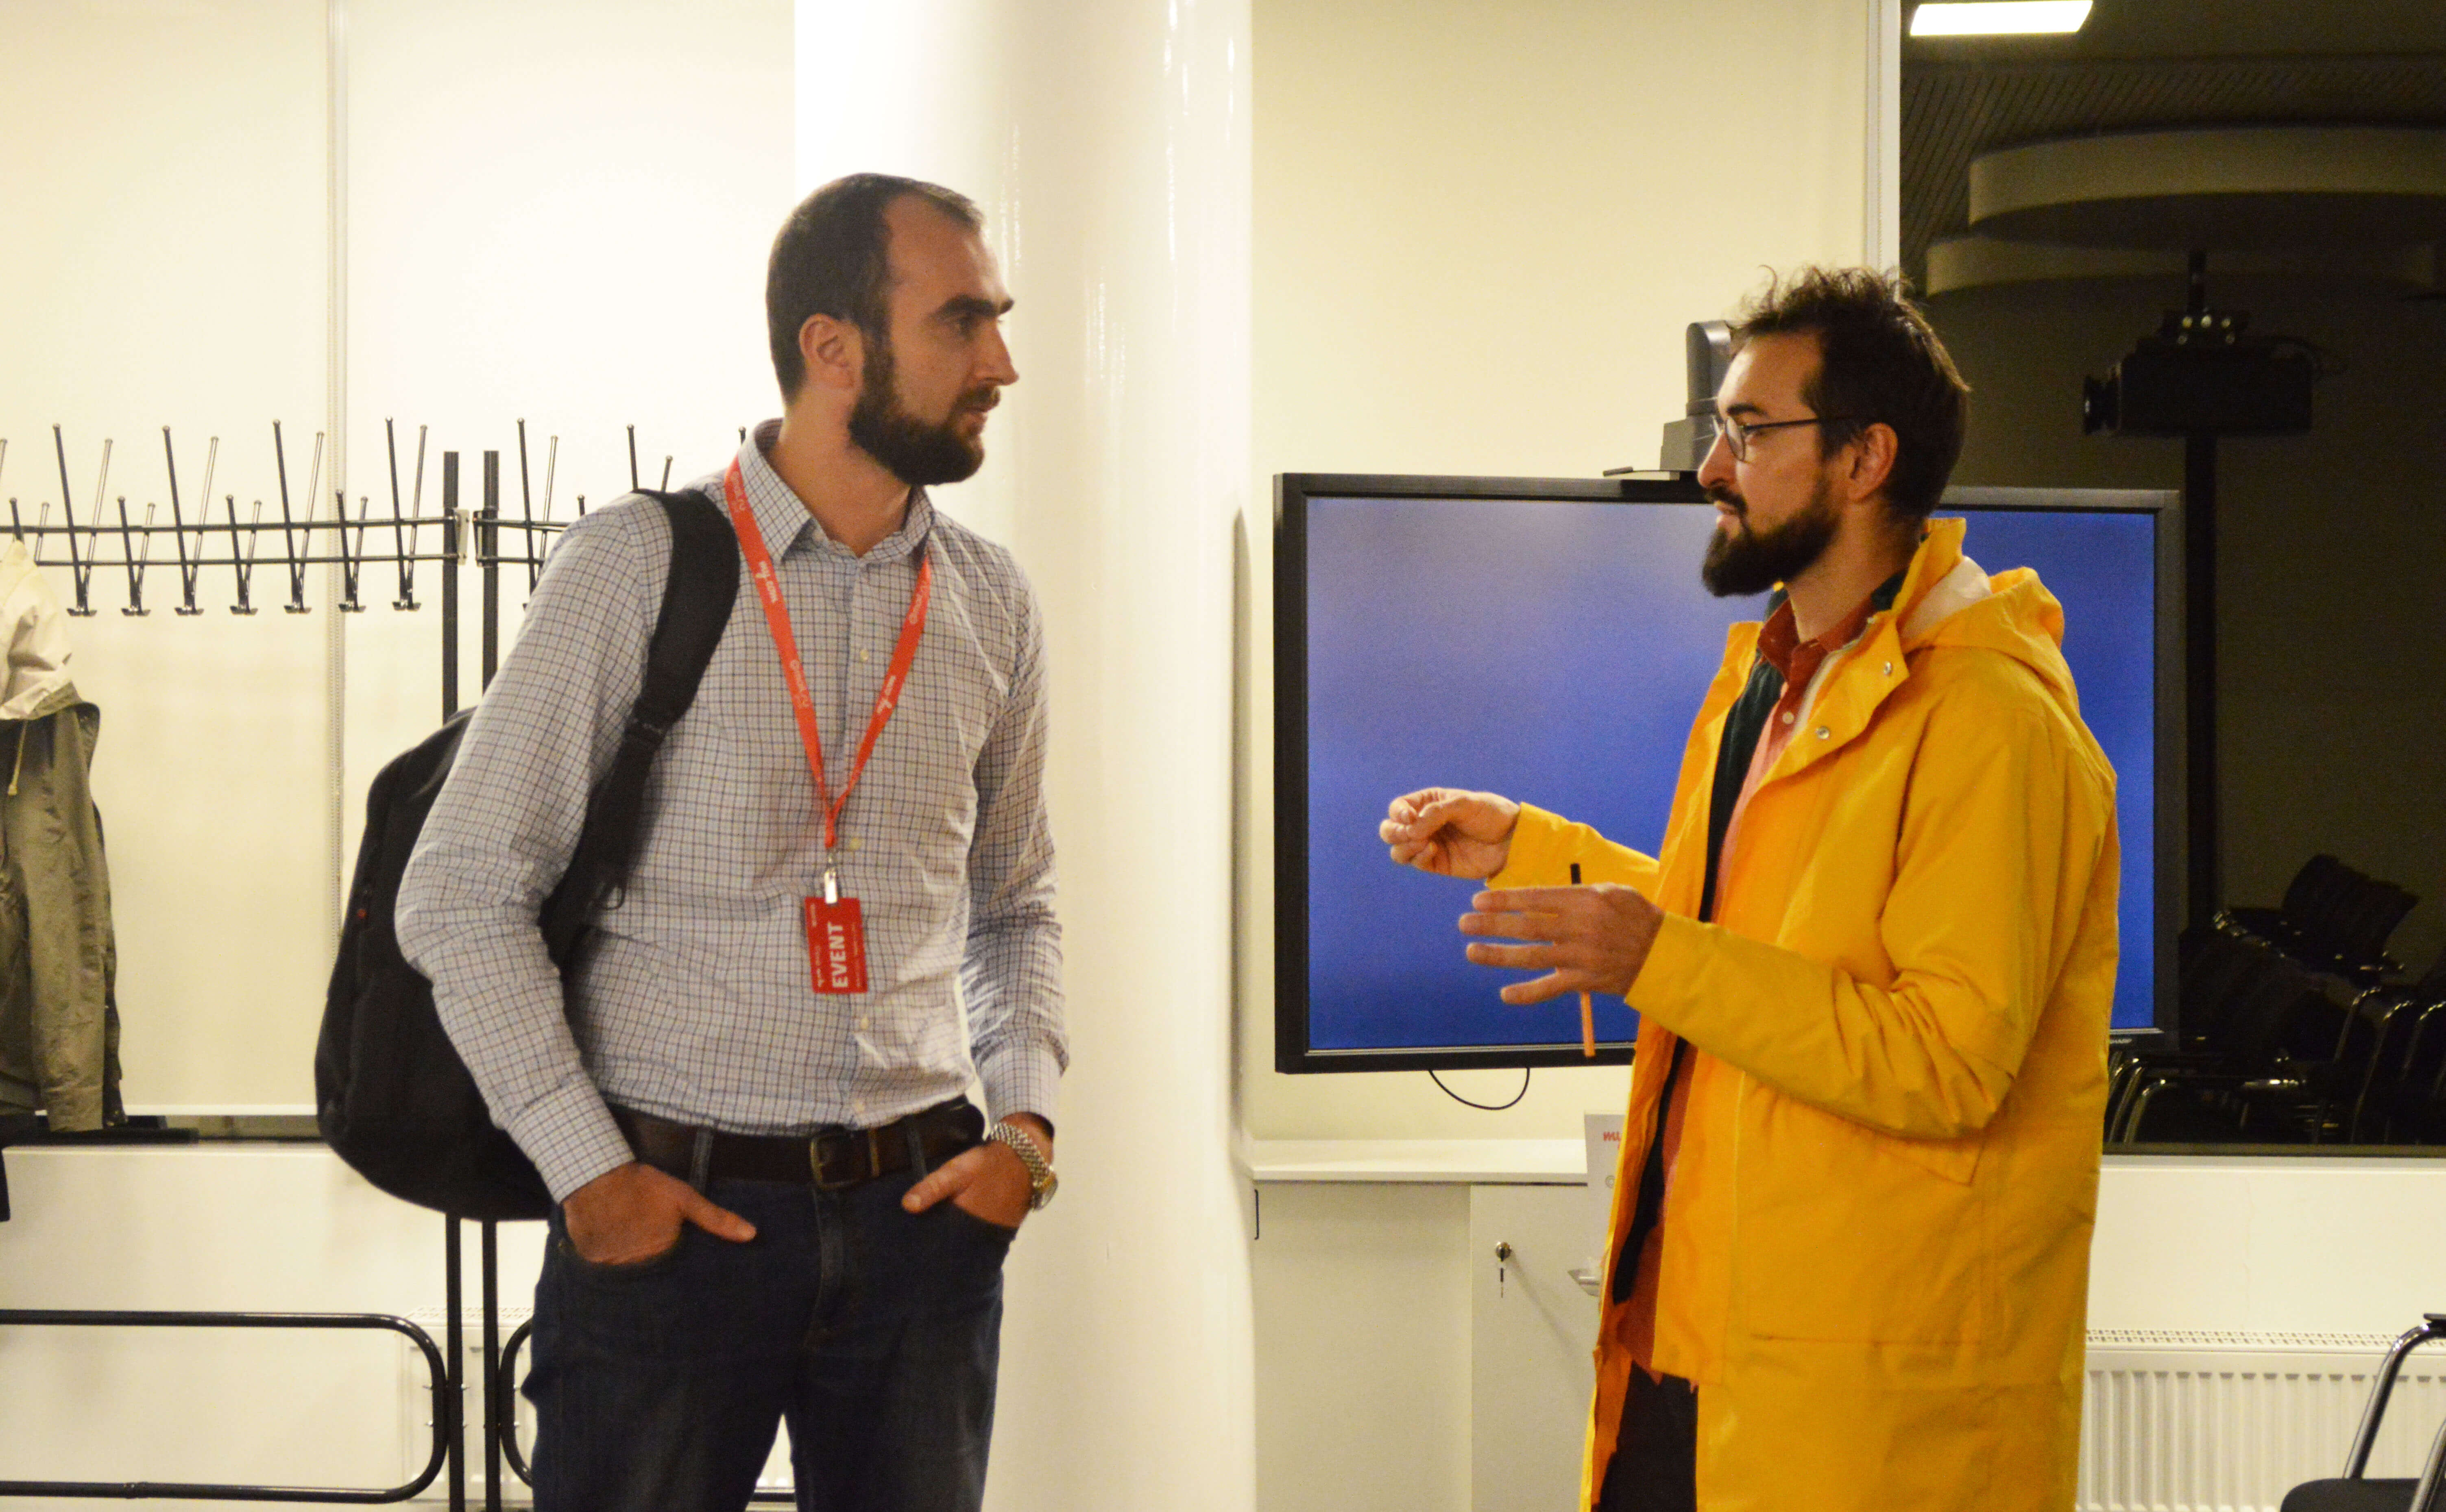
Vadim Shmygov, visual journalist. Photo: Maria Borisenok.
About the program Tableau
Tableau Software is a series of interactive visualization and data processing products that is used to build infographics and create business analytics. The most popular products are Tableau Public and Tableau Desktop.
Tableau Public - a free product. At the same time, all the data used are publicly available with a limit of 1 million lines.
Tableau Desktop - a paid product, there is a free trial version for 14 days. The program allows you to store data on a personal computer and in the profile Tableau Public, as well as work with data from various sources.
“At temporary costs of 20% of the time you will create the basis of work, and 80% will go to finalize color, forms, additional functions. In Tableau, the working project can be exported to JPG or PDF in vector format. This can be useful to those who make statics. ” Vadim Shmygov.
Participants in Mitap. Photo: Maria Borisenok.
Examples of work in Tableau
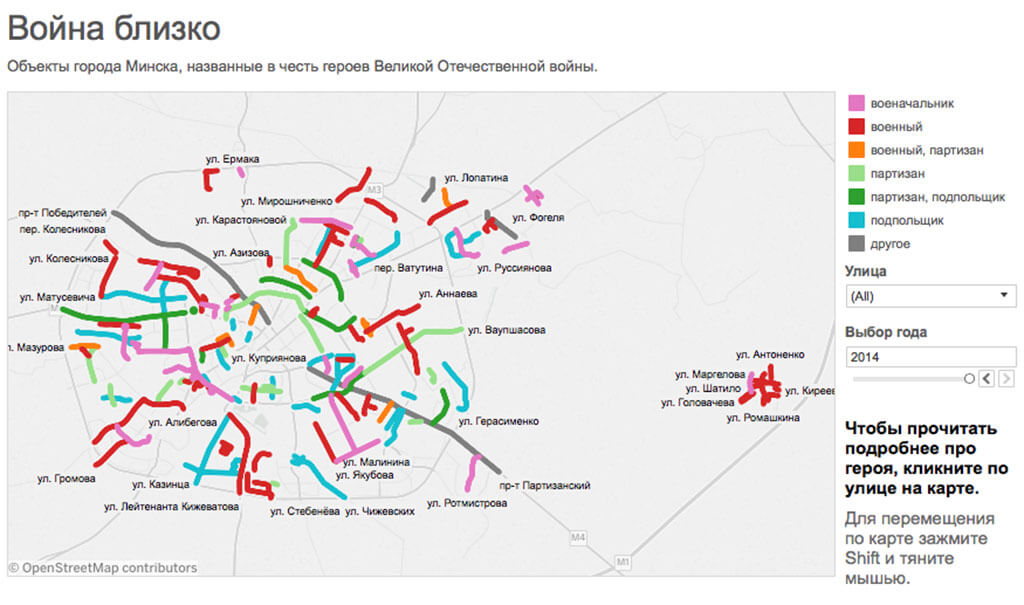
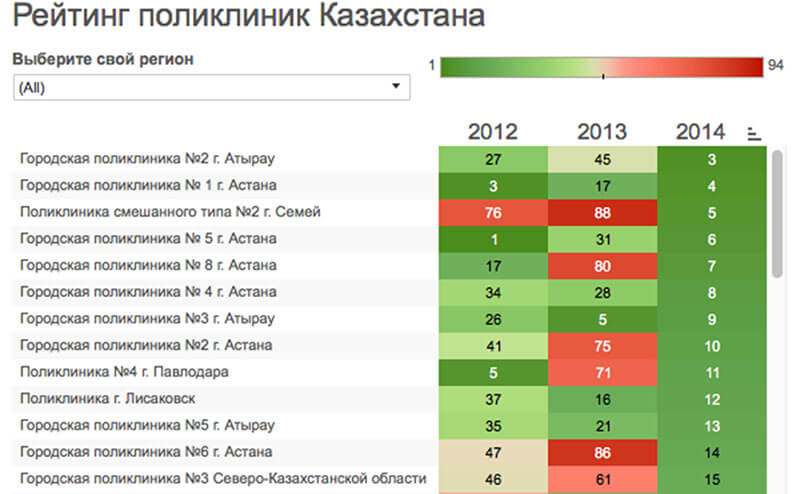
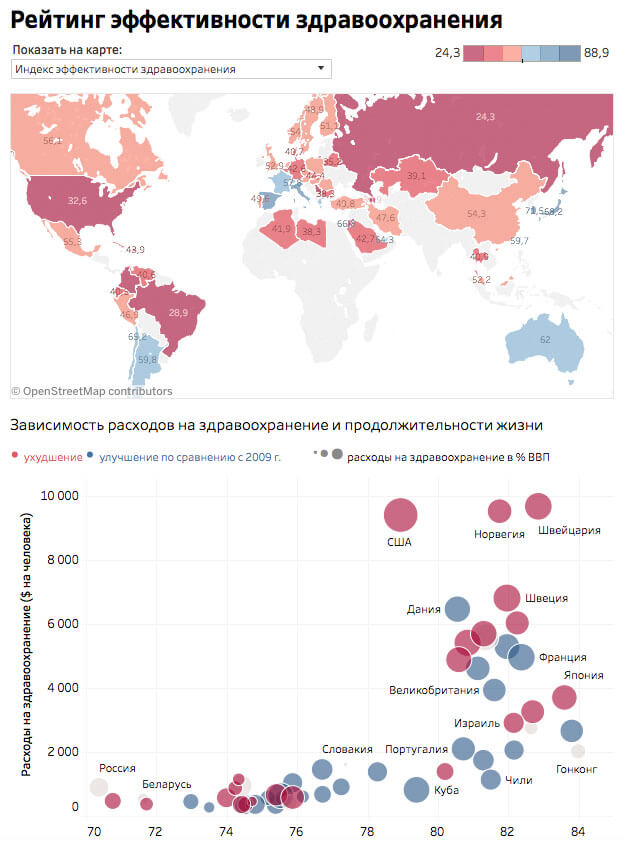
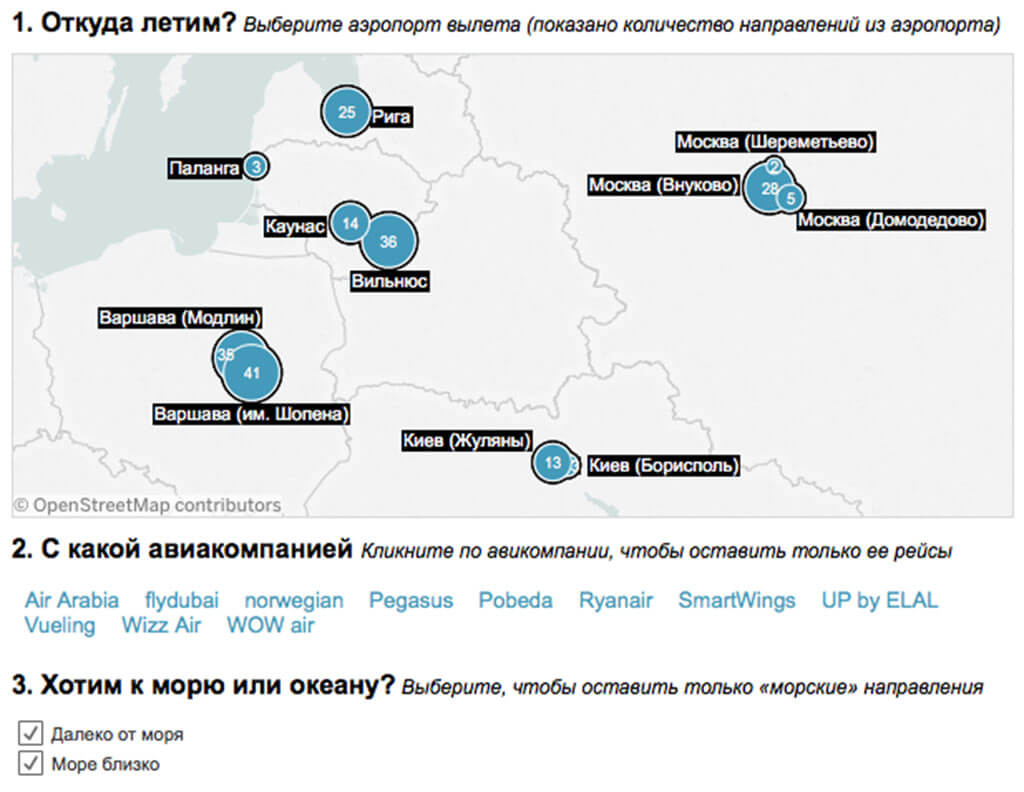
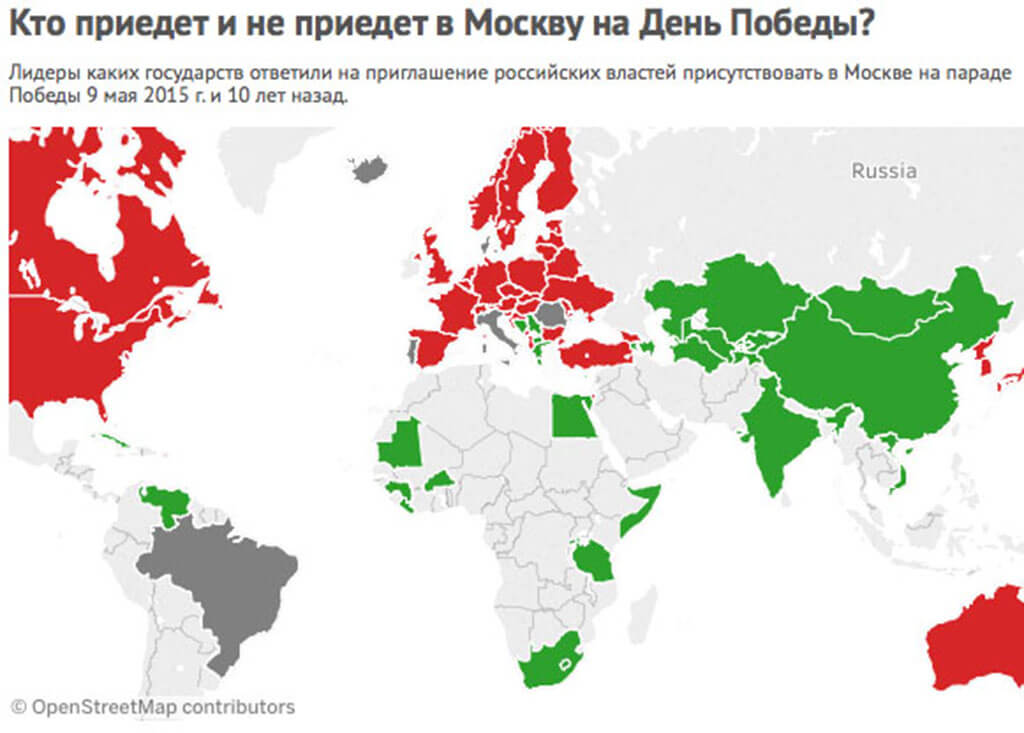
Vadim Shmygov demonstrated examples of infographics in Tableau, solving different tasks: building a rating, analytics of budget data, summing up the year of the year, analysis of political news and public special projects.
Infographics Vadim Shmygov.
Infographics Vadim Shmygov.
Infographics Vadim Shmygov.
Infographics Vadim Shmygov.
“Users are not used to clicking and understanding the possibilities of interactive infographics. People like the graphics and change of slides. Therefore, on the first screen you should have a simple message that you want to convey to the reader. ” Vadim Shmygov
The free version of Tableau allows you to share infographics on social networks. If you have found an interesting pattern in interactive infographics, you can send a link with your schedule settings.
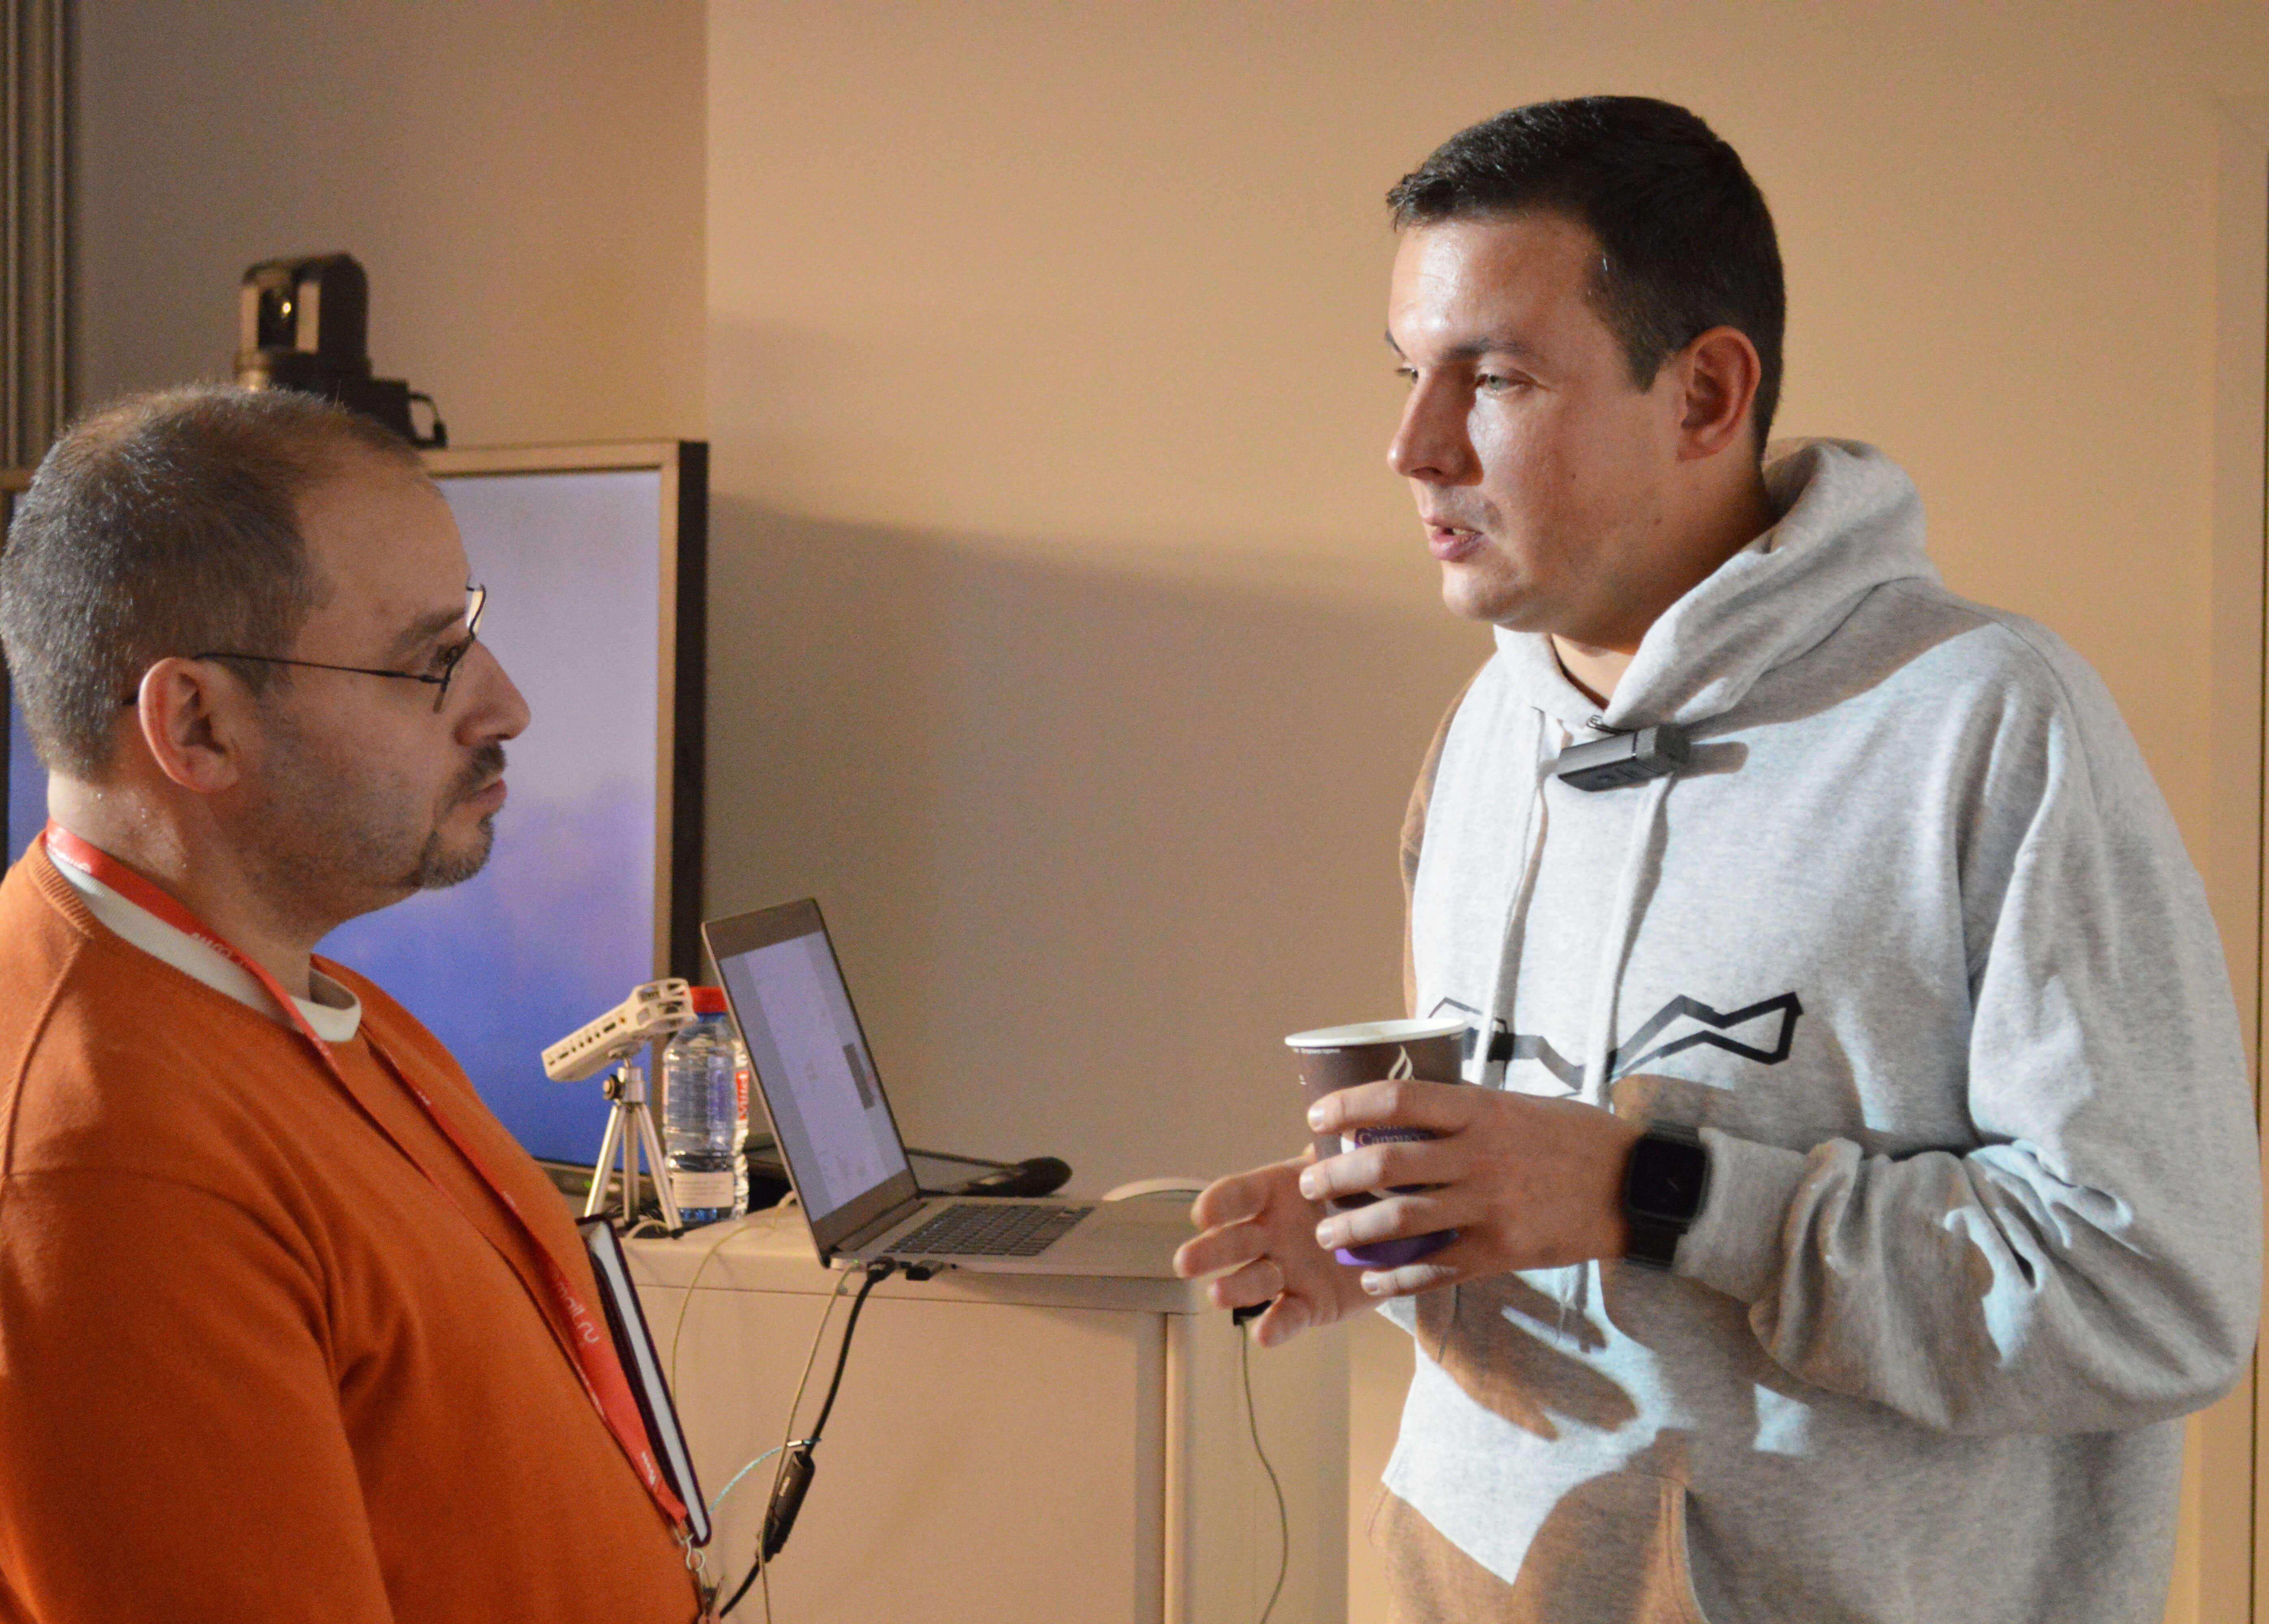
Vadim Shmygov and member of Mitap. Photo: Maria Borisenok.
You can also download Workbook (workbook) of each work in Tableau, see how it was made and access to the database used.