
Translated material
In the Yandex.Dgod service, a pollen distribution map has appeared
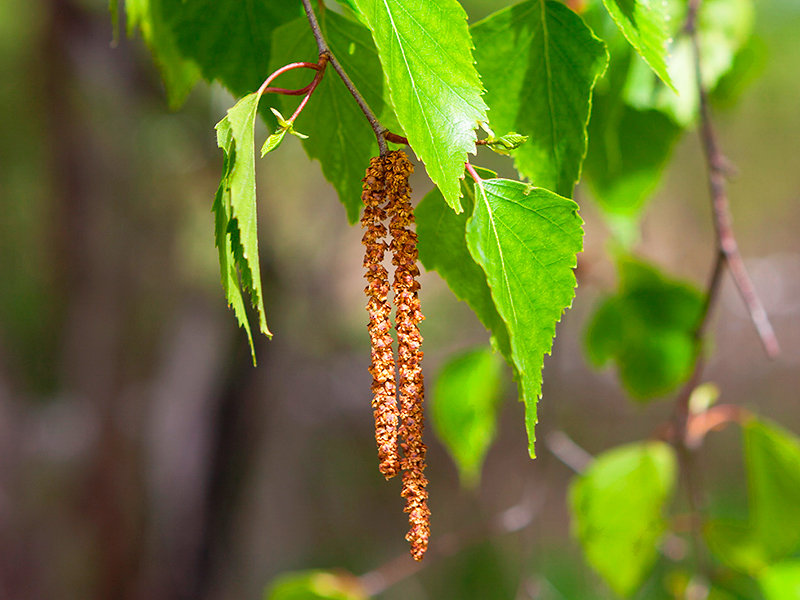
The developers of the Yandex.Dgoda service again expanded its functionality, adding the ability to view the pollen distribution map , which can be very useful for users suffering from allergies.
"The pollen map shows where and at what time, and also with what intensity the plants that cause allergies bloom. The forecast is calculated for a week in advance. The map also shows statistics for the entire season of flowering. The map is presented on the concentration of pollen of the most common allergen plants," the page said on a description of the new service.
The service allows you to view data on the concentration of pollen of many plants: birch, oak, wormwood, alder, ambrosia, ash, willow, hazel, fish, maple, nettle, weeds, cereals, spruce and pine trees. The card shows how the pollen spread area with an accuracy of ten kilometers will change.
According to N+1 , two types of forecasts are available to the service users: seven -day and long -term. The forecast for the week is compiled taking into account meteorological data, including the speed and direction of wind, precipitation, temperature. The forecast for the coming weeks and months is drawn up taking into account the climatic calendar of flowering plants of the selected area. It contains statistical information about the flowering and distribution of pollen, accumulated over the past seven years of observation.
Currently, the pollen map is available for certain territories of the European part of Russia, Moldova, Belarus, Ukraine, Kazakhstan and other neighboring states. To see this card, users need to go to Yandex.Trand and select the Pollen tab in the “Weather on the map” section.
Recall that in November last year, interactive maps of temperature, wind and pressure appeared in Yandex.Tgoda.