
Translated material
Ukraine: Another scale

It was impossible not to follow the election of the President of Ukraine. Unlike Russia, where acute intrigue in the presidential election for the first and last time was observed in 1996, in Ukraine, from seven elected campaigns of the post-Soviet period, only two cost one round-in 1991, when Leonid Kravchuk was elected by the president, and in 2014, when the current head of state, Petro Poroshenko, won. And only once the current president (Leonid Kuchme in 1999) managed to be elected again.
Electoral system of Ukraine in numbers
The total number of registered voters in the first round of voting in the elections of the President of Ukraine amounted to 30.5 million - about 3.5 times less than in Russia (about 110 million). The total number of polling stations is 29,989 (3.3 times less than in Russia), the average number of voters on the site is about 1 thousand people (there are larger in city plots, and less for rural ones). Polling stations are divided into 199 electoral districts in Ukraine plus one foreign district; Unlike territorial election commissions in Russia, the districts are approximately the same in number of voters (about 150 thousand).
The current elections, in which a total of 39 candidates participated, went according to the traditional path. In the first round, the current head of state Petro Poroshenko received 15.95% of the votes, losing almost twice as Vladimir Zelensky (30.24%). The veteran of Ukrainian politics Yulia Tymoshenko (13.40%) and considered by the representative of the pro -Russian forces Yuri Boyko (11.67%) not very far behind the second place [ 1 ]. The turnout of the voters amounted to 62.9%. It should be noted that these results coincided well with the election forecasts and ecridpols of Ukrainian survey services.
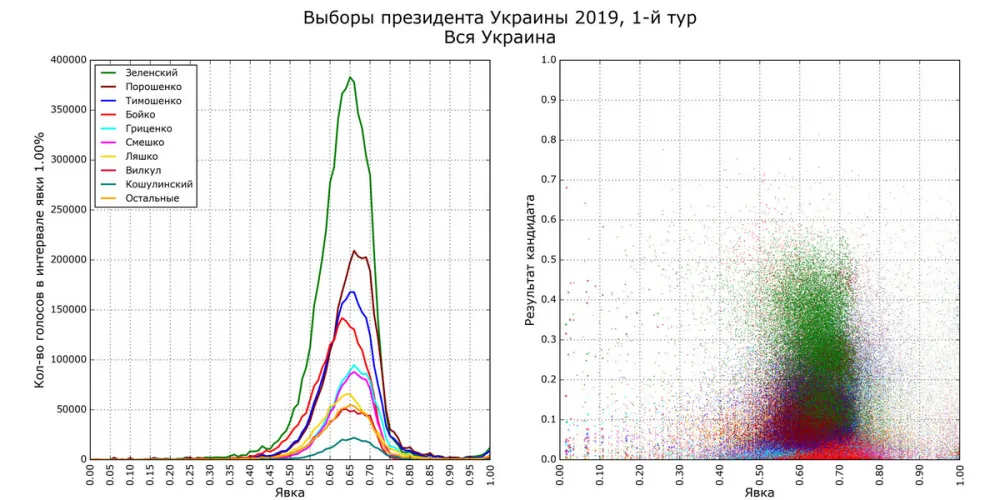
Given close ties and the general past, it is interesting to look at the election results in Ukraine through the prism of the same tools that we used in the analysis of Russian elections [ 2 ]. Let's start with the distribution of votes for the candidates depending on the turnout (Fig. 1).
For comparison - a similar distribution in the elections of the President of Russia in 2018 (Fig. 2).
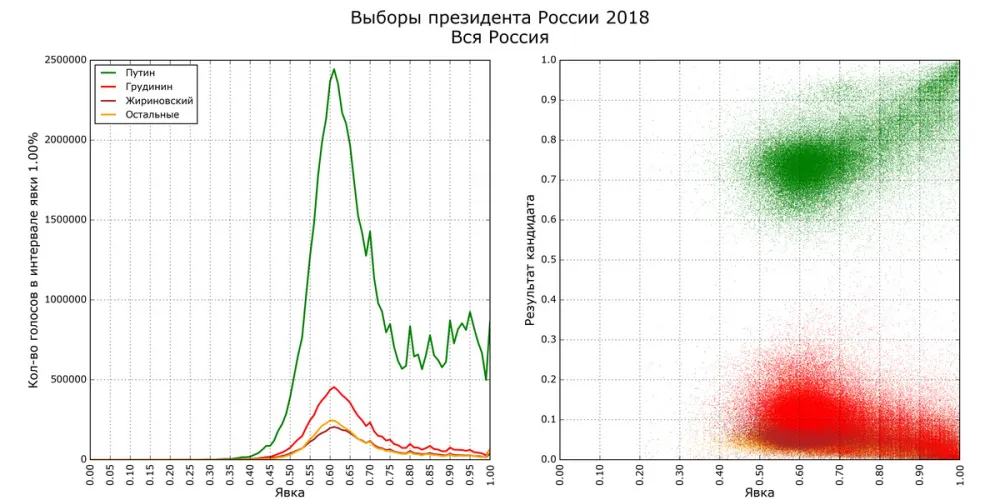
Immediately you can see the fundamental difference between the diagrams of the two countries: in the elections in Ukraine, neither the leader of the voting of Zelensky, nor Poroshenko, for whom the administrative resource could work, have a “tail” of the distribution of votes on high attendance and “comet” in the scattering diagram. Thus, the mass falsifications of the “Russian” type, when the election commissions add votes for the “necessary” candidate, while increasing the turnout [ 2 , 3 ], it is not visible in these elections in the country's scale. On the scale of the regions, the only exception is the Donetsk region, where signs of adding votes for the current president, confirmed by observers from places about stuffing are visible. The scale of these frauds can be estimated at about 40 thousand extra votes for Poroshenko.
At the same time, the diagram for Ukraine is marked by the difference in the votes distributions for different candidates: with a similar form, they are slightly shifted relative to each other in the turnout. This is a consequence of the heterogeneity of the appearance and support of different candidates in different regions. The turnout in the eastern regions of Ukraine is lower, and the more “eastern” candidates (Boyko) have a maximum of votes on lower turnouts, and, conversely, the votes of more “Western” candidates (Gritsenko) are shifted to higher attendants. In the case of Petro Poroshenko, this shift is largely due to the high turnout and high results of the current president in Kyiv (where he performed a member of Vladimir Zelensky) and Lviv (where the result of Poroshenko amounted to almost 44%).
At the regions level, the differences in the vote distributions for different candidates are significantly reduced (Fig. 3).
Rice. 3. Distribution of votes for candidates in two different in political preferences of the regions - Odessa and Lviv regions. In the scattering diagram for the Lviv region, two voting clusters for Petro Poroshenko are visible: the right top corresponds to the city of Lviv, where Poroshenko received about 45% with a turnout of more than 70%, and the left lower - the region, where both the turnout and the result of the current president are less. However, there is no “tail” in a histogram of votes, no “comet” on the scattering diagram and hereCities and villages
In general, the distribution of votes in the regions of Ukraine is similar to the distributions in the "honest" regions of Russia, such as the Arkhangelsk or Sverdlovsk region (and in Kyiv - to Moscow). This contradicts the thesis about the “special” nature of the vote, characteristic of the rural population, which is sometimes put forward by the defenders of the strange results of the Russian elections. In Ukraine, the share of the rural population is greater than in Russia, and nothing of the similar vote in the Voronezh region or Mordovia is observed. Moreover, thanks to well -structured information about the composition of the polling stations of Ukraine, they can be divided into groups by types of settlements and consider the distribution of votes separately in these groups (see Fig. 4).
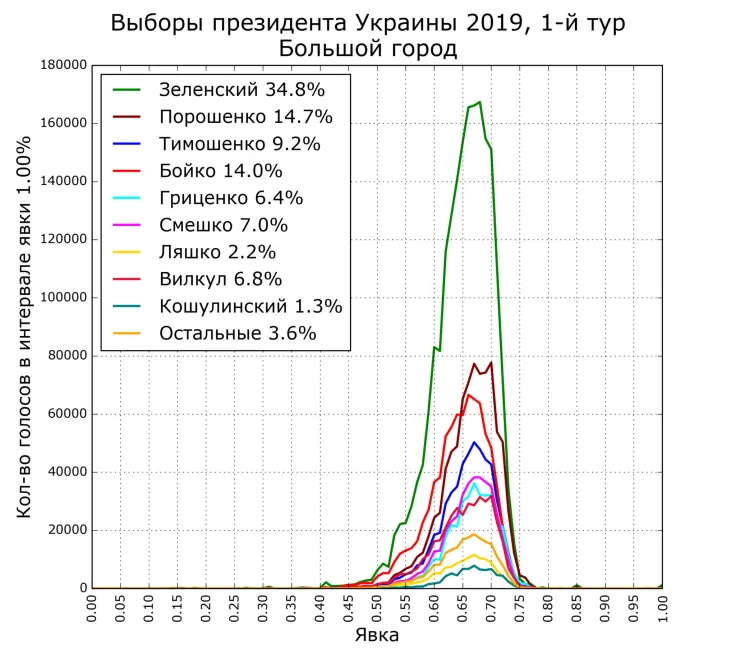
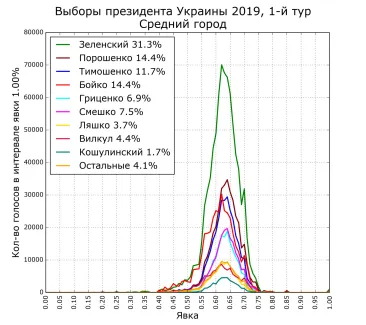
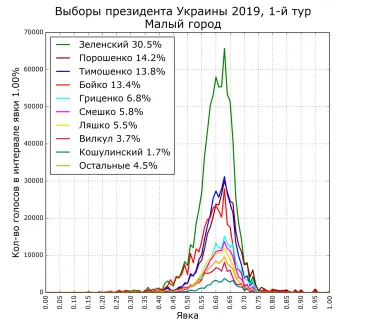
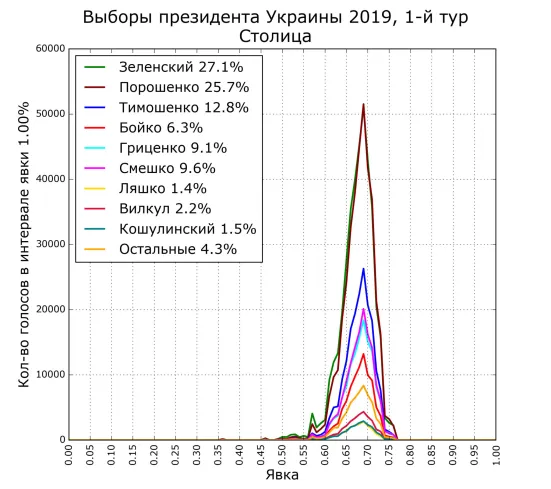
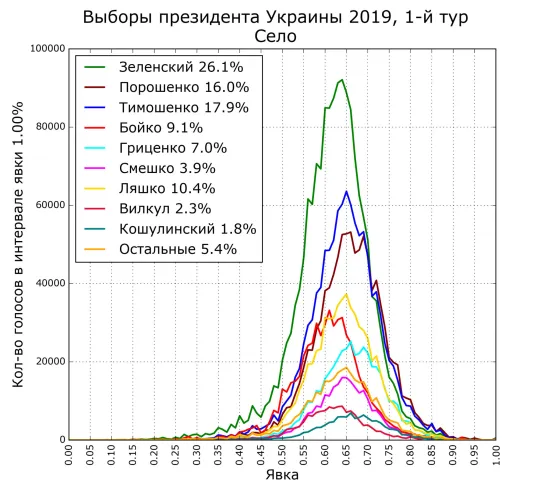 Rice. 4. Histograms of the distribution of votes for candidates for a turnout in settlements of various types - with the number of voters in million: the capital - 2.14; Big City (> 100 thousand) - 8.89; The middle city (20-100 thousand) - 4.15; Small city (<20 thousand) - 4.30; The village is 9.94
It can be seen that the nature of the turnout in settlements of different types is very similar. The highest turnout is in the capital and large cities, the intermediate in the middle cities, the lowest in small ones. In rural settlements, the turnout is approximately at the level of the middle cities (this is also facilitated by the fact that the rural population is more in the western regions, where the turnout is generally slightly higher), and its distribution is slightly wider - but this differences in rural voting are exhausted.
Political addictions differ in the types of settlements slightly more. The result of Vladimir Zelensky is quite even-the highest in large cities (the main contribution is made here by regional centers and industrial cities of the southeast), a little smaller in small and medium, even less in the capital and in rural areas. The result of Petro Poroshenko decreases with the size of the village: above all in the capital, the lower in the villages; The result of Yulia Tymoshenko is the opposite. In general, however, there is no need to talk about some significant difference between cities and rural areas: voters go to the elections with approximately the same hunt and vote in a rather similar way.
Spoilers and correlations
If on the day of voting in the elections of the President of Ukraine, everything, apparently, went honestly, then the election stage could not do without political technological techniques, including on the verge of foul. In particular, Yulia Vladimirovna Tymoshenko, competitor of Petro Poroshenko for going out to the second round, formed a “double”-candidate Yuri Vladimirovich Tymoshenko, People's Deputy of Ukraine from the Ivano-Frankivsk region. Probably, the calculation was that some of the voters would confuse two Yu. V. Tymoshenko in Bulleten and Yulia Tymoshenko will lose part of the votes. The calculation partially justified-Yuri Tymoshenko took 10th place with a result of 0.62% of the vote, of which, apparently, a noticeable part was to belong to Julia. The correlation between the results of Yulia Tymoshenko and Yuri Tymoshenko in polling stations, minus the middle in the constituency (to exclude the influence of regional preferences), is 0.6-significantly more than each of them with any other candidate. Thus, it can be assumed that Yuri got about every 40th voice that Julia was to leave (and this is a realistic assessment for the share of human mistakes in the elections-about the same or slightly smaller share usually make up invalid ballots if the protest meaning is not invested in them). This, however, is significantly less than the final lag of Yulia Tymoshenko from Petro Poroshenko, so to explain the third place of Yulia Tymoshenko only by the spoiler, even taking into account the likely added 40 thousand votes for Poroshenko in the Donetsk region.
Sergey Spilkin
1. Page of the results of the first round of elections on the website of the CEC of Ukraine .
2. Elections of 2018: Factor X and “Pila Churova” // TRV-hunger No. 252 dated 04.24.2018.
3. “Voice” discovered more than 80 thousand non -existent voters // “Echo of Moscow”, 07/17/2018.