Date
Author
Катя Бонч-Осмоловская, Артем Щенников
Source

Preserved copy
Translated material
Did you paint the crown?
Why do Covid-19 incidence data look suspicious in Moscow

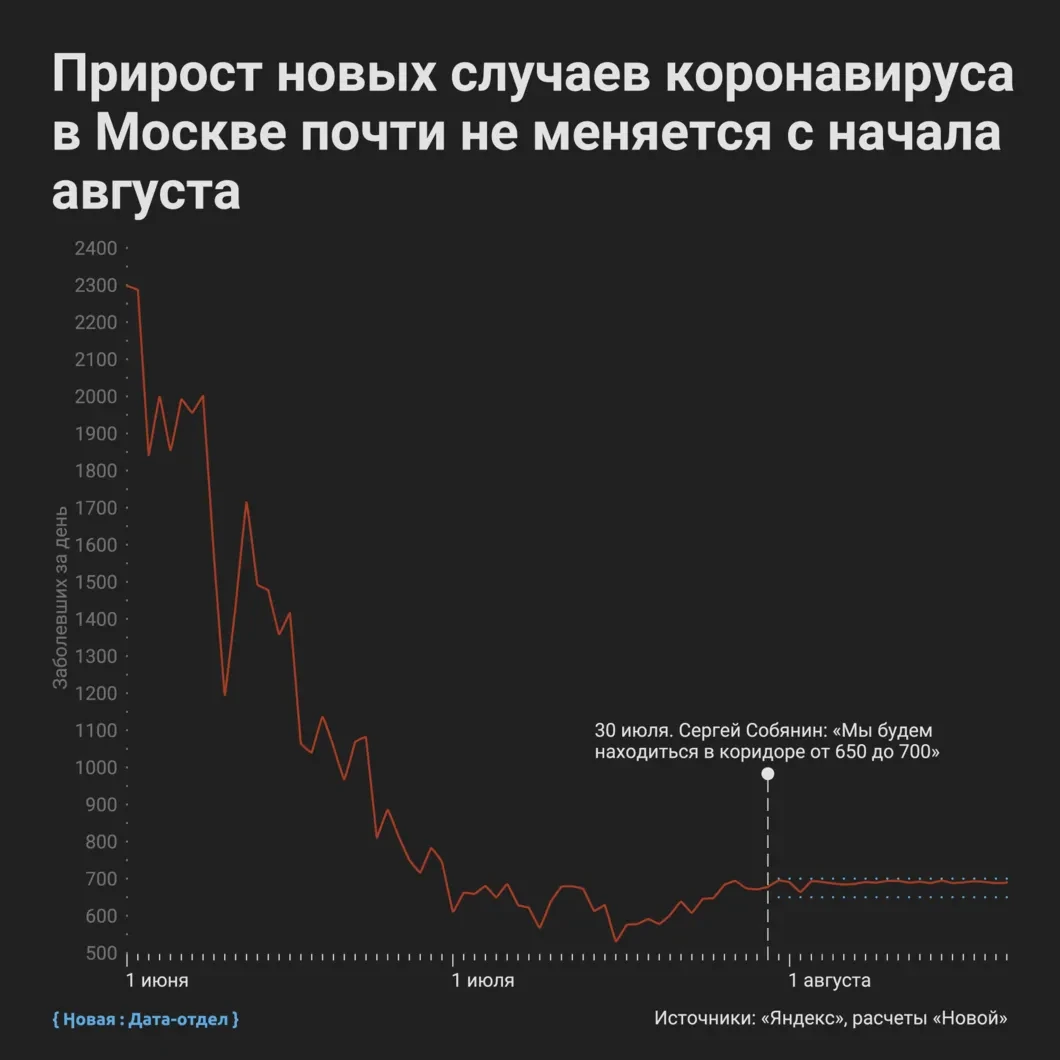
On July 30, Moscow mayor Sergei Sobyanin said that the daily number of coronavirus sick in the capital will "be in the corridor from 650 to 700, plus minus 50". And so it happened: since then the number of identified patients has not gone beyond these limits. Many experts believe that this contradicts the laws of statistics: if the data is not “painted”, there should be more the scatter between them. "New" was versed in how the incidence of Covid-19 in Moscow fell into the "Sobyaninsky corridor".
From the very beginning of the epidemic, the capital was one of the few regions that showed relatively reliable numbers in the number of infected ones. However, immediately after the statement of Sobyanin, the data began to look suspicious: within three weeks, the number of identified patients did not fall below 664 and did not rise above 695 people.
Other regions began to “draw” the incidence in the spring. “New” spoke about the most noticeable anomalies, for example, in the Kursk and Lipetsk regions: the number of identified patients for several days, and somewhere weeks remained stable and did not go beyond the limits of one interval. It seems that Moscow is not always added to the list of areas where statistics are not always working.
Now relatively honest incidence data show no more than ten regions,
Notes the candidate of biological sciences, associate professor of the Department of Sociology of the Higher School of Economics Alexei Kupriyanov. Most subjects began to “draw” statistics in May-June and continue to do this, and it is impossible to restore the real picture of the epidemic according to the invented numbers.
Experts have developed several methods with which you can assess the reliability of regional data. The number of new cases of the disease is a random value that depends on many factors: the number of tests performed, the coronavirus flash in the hospital and other reasons can affect it. Normally, this figure changes every day, deviating from the overall trend in one direction or the other, while the deviation from the trend can be quite large, Kupriyanov explains. Smooth numbers are suspicious:
“Even if there is a steady growth or decline in the number of sick, the number of newly identified cases will either grow or fall day by day. We will be able to understand that we are observing steady growth or decline, only after several days, and even applying to the “raw” data certain methods of “smoothing”. In our case, in many regions, the data immediately look like someone has already applied “smoothing” to them.
If you apply such a technique to data on the identified patients in Moscow, it can be seen that they look “painted” since August - just after Sobyanin’s statement about the “corridor”. Kupriyanov notes that the numbers began to raise doubts even earlier - from the second half of July.
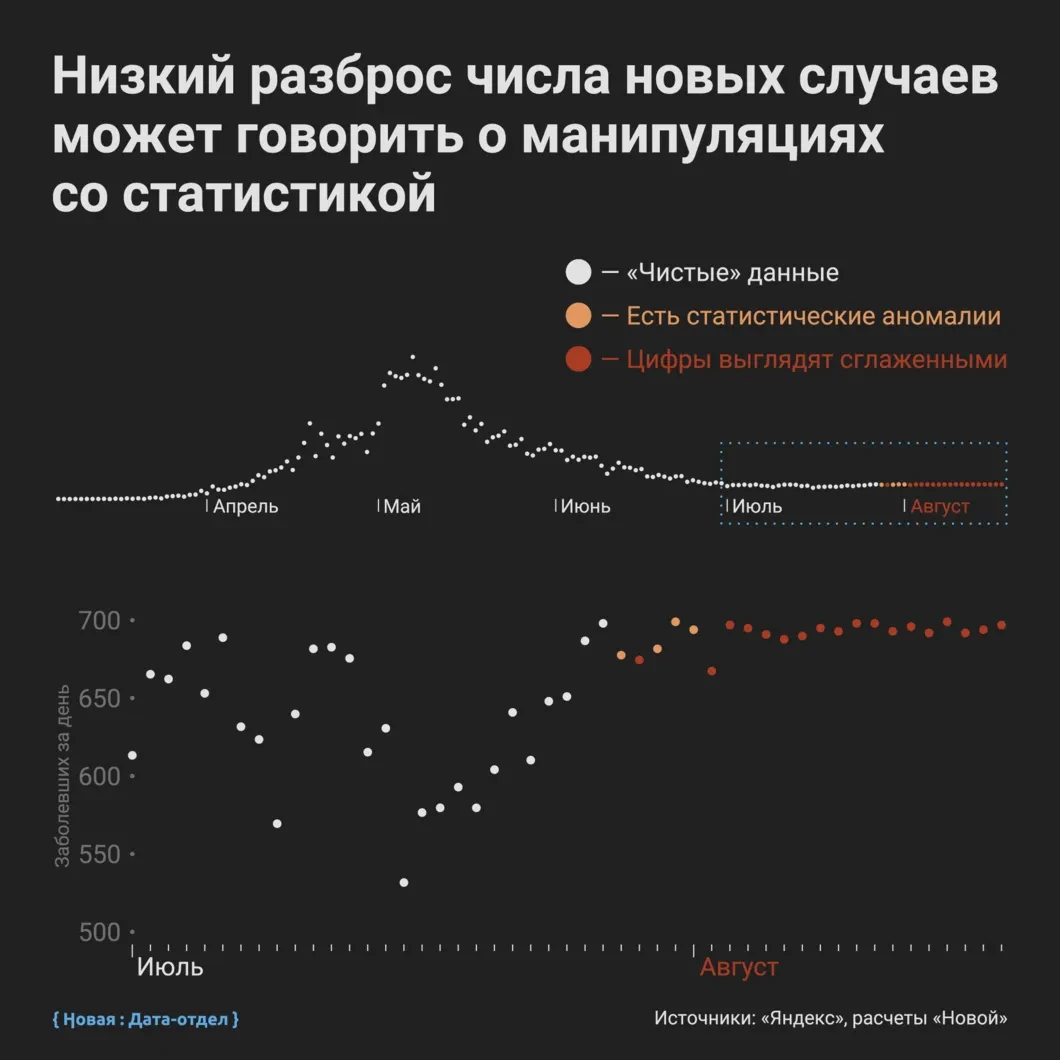
At the same time, it seems that there are no obvious reasons for “drawing” data: the epidemic in Moscow is on the decline. If in April there were half of the new cases on the capital, now less than 15%.
“Perhaps this is an attempt to hide the moderate increase in the number of new cases that was outlined in mid -July. If this is an increase in insignificant and temporary, there is a hope that it can be hidden until the wave again declines, ”Kupriyanov suggests.
In July, both official data and indictors really showed an increase in incidence in Moscow: “New” said that this could be a sign of the second wave. Specialists did not draw unequivocal conclusions and advised to wait for the development of events, but it did not follow - the data rested on the drawn corridor.
Meanwhile, in August, the Moscow depostravom at least ten times reported that "the growth rate of new cases has become negative." The press service of the Novye Department said that the peak of the pandemic in the city has been passed, and the stable number of cases is explained by the stability of the epidemiological situation.
“Over the past month, the number of new cases of coronavirus infection is 5.4% less than the previous one. The main indicator of the epidemiological situation - the average daily growth rate - also remains at a record low level. The number of new cases in Moscow remains at a low level, even despite the increase in the coverage of testing on coronavirus. <...> The situation was stabilized, this is exactly what the minimum fluctuations in the number of sick are explained, ”the editorial office said in deprosva in response.