
Translated material
Traffic jams in St. Petersburg: how bad is everything?
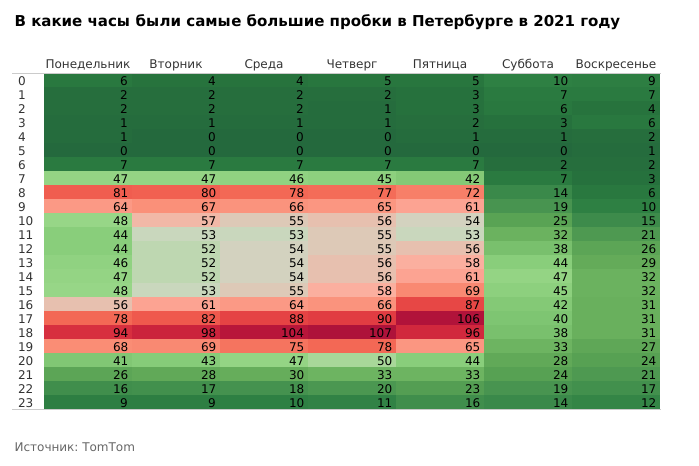
Green, orange, red and dark-bearded. The darker the color, the longer the cork.
TomTom navigators are used in Volkswagen, Hyundai, Subaru, Mazda and Toyota, as well as in the Uber service.
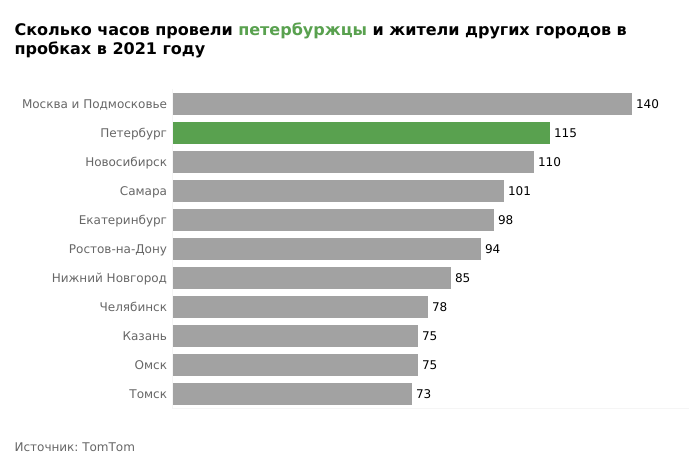
14th place, 101 hours
15th place, 98 hours
23rd place, 94 hours
32nd place, 85 hours
48th place, 78 hours
56th place, 75 hours
58th place, 75 hours
62nd place, 73 hours
The only exception was San Diego with 1.38 million inhabitants. In the last place of the list was the Dutch city of Almer. In 2022, local drivers spent 68 hours in traffic jams.
Researchers compared the level of traffic jams with 2019.
Therefore, on a trip, which should take half an hour, Petersburg drivers had to spend more than 58 minutes.
Consequently, on a half -hour trip, Petersburg drivers had to spend more than 54 minutes.
Residents of St. Petersburg due to traffic jams spend more than 100 extra hours a year-this is one of the highest rates in the world. The highest roadload is observed at 18:00 Thursday. And the most unfavorable month for St. Petersburg drivers is December. CHARTS OF THE COMPORTANCE OF VISITS OF POTIN, snowfall and rehearsals of military parades more often.
These are the main conclusions from the study of “paper” about traffic jams on the roads of St. Petersburg. We analyzed the data for 2019–2021, as well as separately for the 2022th, since many international companies excluded Russian cities from their research because of the war in Ukraine.
We show on the graphs how dense traffic is in the city, when the road situation is worst and when traffic jams, on the contrary, are less than usual.
How is the TomTom rating about road workload? ↓
TomTom studies cover the period from 2019 to 2021. The company arranges the cities in the list, depending on the level of road load, which is calculated taking into account the extra time spent by drivers on the roads. Researchers receive data from the GPS navigators that the company produces.
That is, when the average level of workload of St. Petersburg roads is 50 %, the driver spends 1.5 times more time than on the same trip along an empty road. For example, if a trip on an empty road would take half an hour from the driver, then because of traffic jams he will have to spend 45 minutes at the wheel.
Table of contents:
1. Petersburgers spent 115 hours in traffic jams in 2021 . Russian drivers spend more time only in Moscow and the Moscow Region.
2. Traffic jams most often occur in St. Petersburg on Wednesdays and Thursdays . The most unfavorable clock - 8:00, 9:00, 17:00, 18:00 and 19:00.
3. Putin's visits, snowfalls and rehearsals of military parades affect the emergence of traffic jams.
4. December - the most busy month for St. Petersburg by traffic jams . In the last year, June was equal to him.
Petersburgers spent 115 hours in traffic jams in 2021. Russian drivers spend more time only in Moscow and the Moscow Region
Petersburg took seventh place in the anti -rating of the cities of the world, in which traffic jams are taken away most of the drivers. This is evidenced by the study of the manufacturer of the GPS navigation of TomTom for 2021.
How is the TomTom rating about road workload? ↓
TomTom studies cover the period from 2019 to 2021. The company arranges the cities in the list, depending on the level of road load, which is calculated taking into account the extra time spent by drivers on the roads. Researchers receive data from the GPS navigators that the company produces.
That is, when the average level of workload of St. Petersburg roads is 50 %, the driver spends 1.5 times more time than on the same trip along an empty road. For example, if a trip on an empty road would take half an hour from the driver, then because of traffic jams he will have to spend 45 minutes at the wheel.
According to TomTom, in 2021, Petersburgers spent about 115 hours in traffic jams. On average, St. Petersburg drivers spend 50 % more time than is needed for traveling on an empty road, follows from the results of the company's research.
Worse than in St. Petersburg, the road situation is only in Istanbul (first place), as well as in Moscow and the Moscow Region (second place), TomTom noted. Further in the ranking are Kyiv, Bogota, Mumbai and Odessa, which occupy the third to now, respectively.
In the global anti -rating, nine more Russian cities fell, their list was “paper” . Novosibirsk took ninth place: drivers there spent 110 extra hours in traffic jams. Also on the list there is Samara , Yekaterinburg , Rostov-on-Don , Nizhny Novgorod , Chelyabinsk , Kazan , Omsk and Tomsk .
In total, 404 cities fell into the anti -rating of TomTom. In the lower places of the list were American cities whose population does not exceed 500 thousand people-Minneapolis, Daiton, Kansas City, Little Rock, Syracwus, Acron, Winston-Sale and High-Point. On average, local residents spent about 20 extra hours in traffic jams.
The last place in the ranking was taken by Mecca in Saudi Arabia. Local drivers spent only 16 extra hours a year in traffic jams.
According to the updated TomTom rating for 2022, the average time that drivers spend in traffic jams has grown significantly. London turned out to be the most loaded city - the British stood in traffic jams for 325 hours. The Indian Bangalore, Irish Dublin, Japanese Sapporo and the Italian Milan also fell into the first places. Almost all lower places of the list are also occupied by American cities with a small population-Deuton, Oklahoma-City and Knoxville.
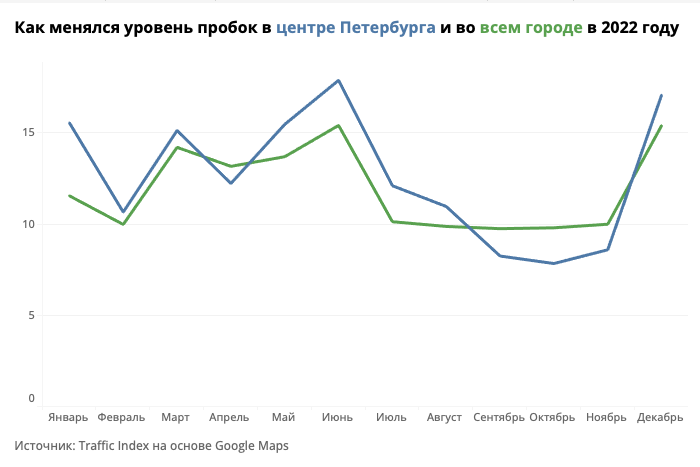
At the same time, in the road situation of St. Petersburg in 2022 there were no serious changes: the average level of road load in the city amounted to 11.94 %, calculated “paper” based on the data of the site Traffic Index. The average level of traffic jams in 2021 was 14.7 %.
How does Traffic Index consider the level of traffic jams? ↓
The team of the site Traffic Index every 20 minutes retains the image of the Google Maps service that fixes traffic jams in the city using color . Subsequently, Traffic Index calculates the level of traffic jams according to the formula: the share of “green plots” × 0 + the share of orange areas × 1 + the share of red areas × 2 + the share of dark-barding plots × 3.
The maximum value of the level of traffic jams in this formula is 100 %. In this case, the whole city on Google Maps consists of dark-bend plots.
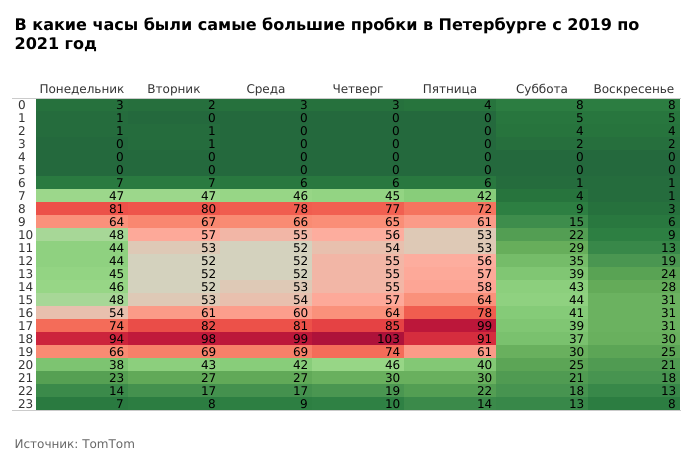
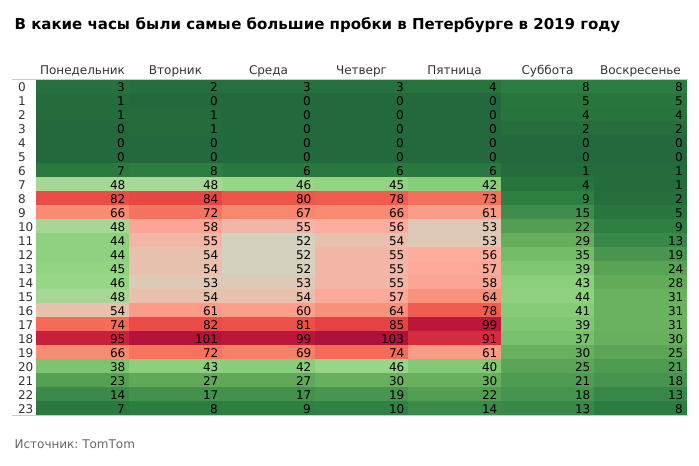
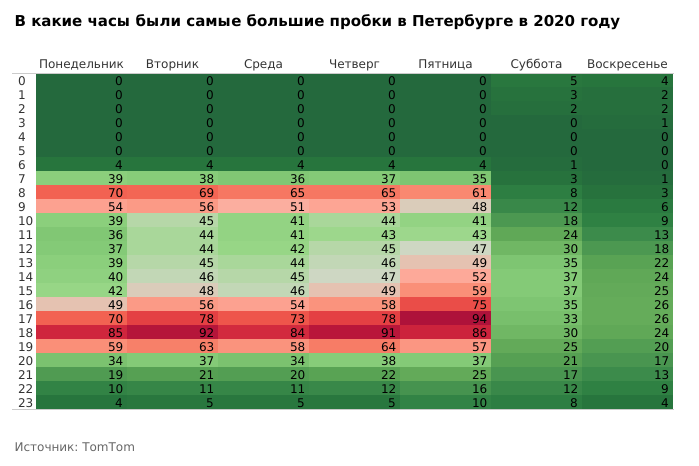
Traffic jams most often occur in St. Petersburg on Wednesdays and Thursdays. The most unfavorable hours - 8:00, 9:00, 17:00, 18:00 and 19:00
According to TomTom researchers, in 2021 the average travel time in St. Petersburg increased by 4 minutes a day compared to 2020 indicators, which the company previously recorded. At the same time, the most loaded days are Tuesday (traffic jams on this day take 44.5 % more than the time of citizens), Wednesday (43 % more time) and Thursday (45 % more time), calculated “Paper” based on TomTom data.
Less often, traffic jams arise in St. Petersburg on weekends, TomTom found out. On Saturdays, traffic jams took 18.5 % of the usual time on the road, on Sunday - 12.5 %.
The morning hours of peak in St. Petersburg are 8:00 (the trip takes 77 % more time) and 9:00 (64 %). The largest traffic jams occur in 17 (the trip takes 81 %more time), 18 (94 %) and 19 hours (66 %).
The most loaded time throughout the week was 18:00 Thursday-on this hour on average per year, due to traffic jams, drivers spend 103 % more time on the trip.
Putin's visits, snowfalls and rehearsals of military parades influence the occurrence of traffic jams
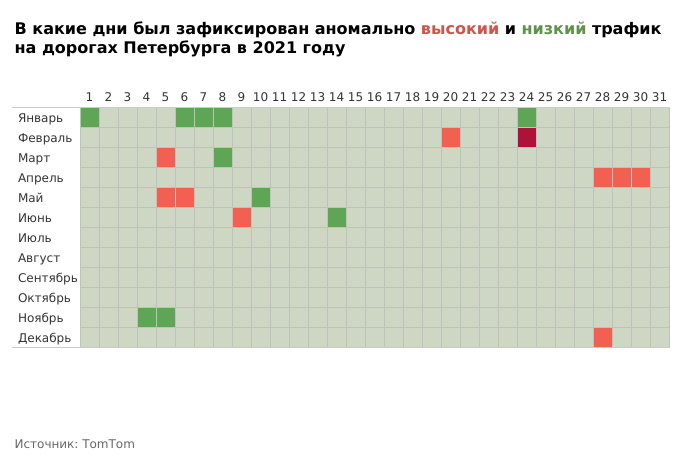
Over the course of 2021, TomTom researchers also recorded days with abnormally high and low road load. According to these data, the most free roads were in St. Petersburg on holidays, when the townspeople did not work - after the New Year, March 8, on the Day of National Unity and May 10, after the Victory Day.
The largest traffic jams arose when the weather was bad in the city, accidents or when officials came on a visit, the “paper” found out, having studied the days of abnormal traffic on the roads of St. Petersburg.
What days were the largest traffic jams in 2021:
- The largest traffic jams in 2021 were February 24, when the average level of road workload, according to TomTom, reached 94 % . On this day, 9-point traffic jams formed in St. Petersburg, drivers complained about snowdrifts and cars. The day before, about 87 % of the monthly rainfall fell in the city.
- Next time, an abnormally high traffic was recorded on March 5, 2021. In the evening on this day, trains stopped walking towards Devyatkino station on the Red Metro line. It was reported about the fall of the passenger on the way. Fontanka wrote about 8-point traffic jams on the eve of March 8.
- Throughout April 28, there were also large traffic jams in St. Petersburg and the Leningrad region. Then there was wet snow and rain, a residential building caught fire on Bolshoi Prospekt P.S., 57, which was stewed six fire engines. Traffic jams arose on the neighboring streets of the Petrograd side, the traffic police traffic controller worked on the spot.
- On Friday, April 29, St. Petersburg drivers fell into 8-point traffic jams at the Moscow and Finland Stations. Residents also stood in traffic jams at the metro station "Admiralteyskaya", "Gostiny Dvor", "Sennaya Square", "Technological Institute", "Alexander Nevsky Square" and to the room near the Obukhovo metro station. The cake occurred on the eve of the overlap of two strips of the room at the intersection with the WHSD and the country avenue.
- On April 30, the authorities blocked Nevsky Prospekt to rehearse the parade on May 9 on Palace Square, military equipment and 4 thousand troops participated in it. Because of this, part of the transport changed the routes. By evening, traffic jams of 8 points formed on the roads of St. Petersburg.
- On May 5, 7-point traffic jams were formed in the center of St. Petersburg. Then the transport did not go along the Palace and Admiralty embankment, Kutuzov’s embankment and the Voznesensky Prospekt section - the highway was not opened after the rehearsal of the military parade.
- On Thursday, May 6, strong rains passed in St. Petersburg, after which traffic jams also occurred.
- On the morning of June 9, Petersburgers fell into 6-kilometer traffic jams on a room in the Rzhevsky forest park due to the repair of a paid highway. The drivers also stood on the site of the inner ring where the accident occurred.
- On December 28, an informal CIS summit was held in St. Petersburg, which was visited by Vladimir Putin. Because of this, some sections of the WHSD and KAD were blocked in the city, as well as several streets, next to which the president was supposed to pass. By evening, traffic jams reached 10 points.
In June 2022, the Center of St. Petersburg was blocked due to the Scarlet Sails festival, follows from the Traffic Index data. Also this month, the St. Petersburg International Economic Forum (PMEF) was held , which was attended by Vladimir Putin.
The President of Russia also came to St. Petersburg in December 2022-to a new informal meeting of the leaders of the CIS countries. In the days of the summit in the city, according to Traffic Index, traffic jams of 8 points were formed.
December is the most loaded month for St. Petersburg by traffic jams. In the last year, June was equal to him
According to TomTom, the largest traffic jams in St. Petersburg arose on the eve of the New Year in December 2021. On average, for a month, drivers spent 78 % more time on the road. For comparison: over the same period of past years, the percentage of extra time spent by St. Petersburg drivers on trips was 58 in 2020 and 56 in 2019.
The lowest averaged workload of St. Petersburg roads for three years, TomTom researchers recorded during anti -like restrictions . So, in March 2020, it amounted to 42 %, in April dropped to 17 %, and in May rose to 22 %.
In June 2020, when the city resumed the movement of public transport and began to cancel restrictions, road load increased to 35 %. In July, it rose to 41 %, exceeding the indicator of the 2019 (38 %) and 2021 (37 %). In the future, the percentage of extra time on the road in 2020 was close to the indicators of 2019 and 2021.
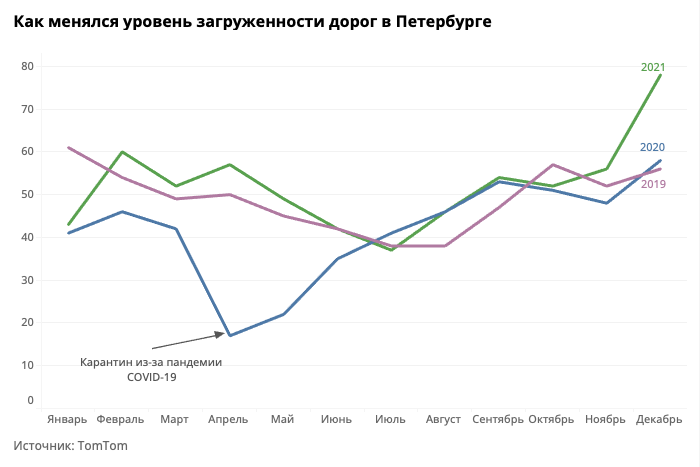
At the same time, in 2022, the roads in St. Petersburg were strongly loaded not only in December, but also in June-the level of traffic jams in the city then amounted to 15.4 %, calculated the “paper” based on Traffic Index data .
We work for you - draw up a donat so that the “paper” will continue to write about events in St. Petersburg
Support 💚What else to read:
- The study of “paper” about crime in St. Petersburg : is it safe in the city, with cases of drugs and weapons and whether the war influenced.
- Two -thirds of the murders of women in Russia are associated with domestic violence. This is more than 12 thousand deaths over the past 9 years. We retell the study of the consortium of female NGOs .
Photo: Alexander Petrosyan / Kommersant