
Translated material
"The hottest day on the planet" for three days in a row

How is it even measured? Will it be completely unbearable soon?
Monday, July 3, 2023, became the hottest day on the planet in the entire history of observations. But already on Tuesday, the record was broken. The average temperature on the planet reached 17.18 degrees Celsius and lasted two days. Does this mean that soon there will be completely unprecedented heat? "Cold" explains how it is generally measured and why.
In order not to miss the main materials of the "cold", subscribe to our Instagram and telegram .
Buckets and global cooling
In order to isolate the influence of a person on fluctuations in the global temperature, scientists do this: they take observation data, and then subtract from them those vibrations that were assigned to the account of natural factors. What remains is the influence of civilization.
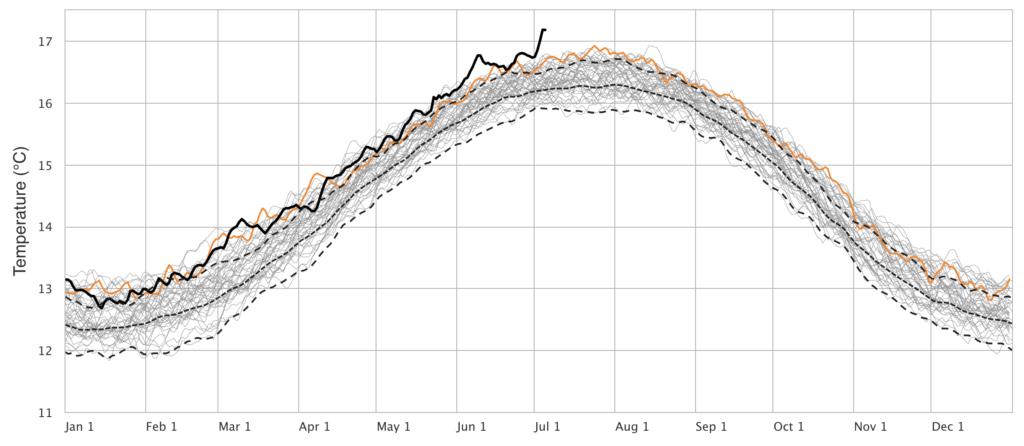
Source: Birkel, SD 'Daily 2-Meter Air Temperature', Climate Reanalyzer , Climate Change Institute, University of Maine, USA.
Climatologists thus processed the temperature data from 1880 to 2000 and saw that after deducting natural factors, the temperature was constantly growing, but not continuously: in some years the schedule dropped sharply (and then continued growth). For all such falls, an explanation was quickly found: they were associated with volcanic eruptions, in particular with the eruption of the Pinatubo volcano in June 1991. During the eruptions in the upper atmosphere, a huge amount of volcanic ash is obtained, which retains solar radiation and cools the surface of the planet.
But it was not possible to find an explanation only to the most noticeable drop in temperature - in 1945. The version of the connection of cooling with the nuclear bombing of Hiroshima and Nagasaki was rejected: these events together could not give an effect more than 0.03 degrees, while the fall was 10 times more.
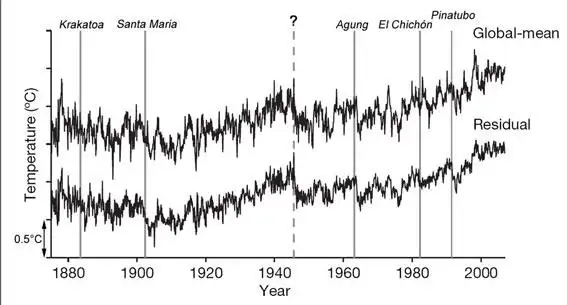
Climatologists began to understand - and saw another oddity. The average global temperature is calculated based on the temperature measurements in the ocean and on land. So: there was no fall in the continental data. And the scientists realized that the matter was in some kind of systematic measurement error-and its cause was a bucket.
Meteorologists received data on water temperature in the ocean mainly from ships, and with the outbreak of World War II, the ratio of data received from the vessels of the British fleet and the US fleet has sharply changed. The Americans began to supply about 80% of the data, and the British - only 5%. Since August 1945, when the war ended, the ratio has changed again: 50% of the dimensions were now transmitted by the British, and 30% - Americans.
The reason was in different methods: British sailors lifted outstanding water for measurements using buckets, American - measured the temperature of the water, which was supplied to cool the engines. In the first case, the water turned out to be on average slightly colder, in the second due to the heat of the engine - a little warmer. British buckets created the "global cooling" of the second half of the 1940s.
Take care of the sun, wind and rain
These distortions are easy to adjust and see what is happening with the climate in reality. But just 150 years ago, we would simply not have learned about global warming - and about yesterday's temperature record too. People were engaged in meteorological dimensions before, but these data did not develop in the overall picture: there were few weather stations, the measurement methods were different, like the measuring devices themselves.
Imagine that you are sent to temperature data, but you do not know how exactly they were received, at what time of the day the readings were filmed, whether the thermometer was protected from direct sunlight or from the wind. How can you compare them, how can they be averaged? And if you add that you have the number of weather stations over time, are the results of observations from the meteorosonds, from satellites, and the accuracy of measurement changes? Therefore, the average temperature on the planet ultimately is the result of a huge work in which not only a lot of measurements, but also a lot of mathematics.
Now the simplest procedure for measuring air temperature at weather stations is strictly regulated: thermometers should be in special booths at an altitude of two meters, where they are protected from precipitation, sunlight and strong wind.
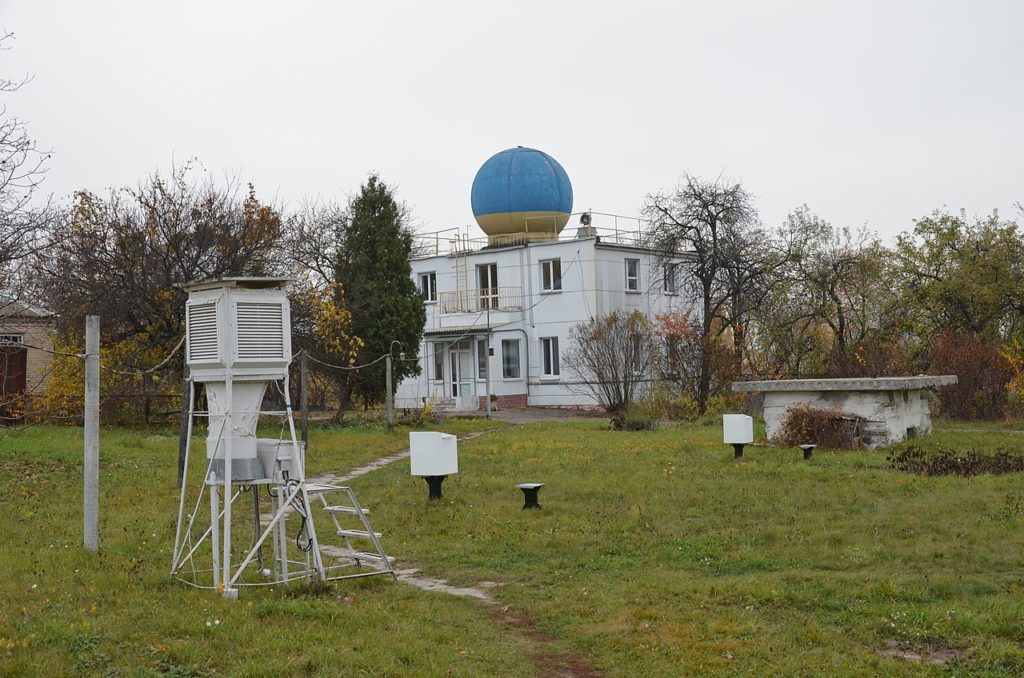
All the world weather stations measure the temperature simultaneously every three hours, starting from midnight according to Greenwich. The maximum and minimum temperature is measured separately every 12 hours with special thermometers , which fix the minimum or maximum values.
Now climatologists use the data of tens of thousands of ground weather stations ( here you can see historical data from them). For example, in the latest version of the NOAAGLOBALTEMP dataset created by the NOAA American meteorological department, information from 26 thousand weather stations on land. But this is not enough: this also includes data from ships, with a set of measuring storms; Finally, the surface temperature data is obtained from satellites, for example, from Modis radio meters on Terra and Aqua American satellites (better known fire data).
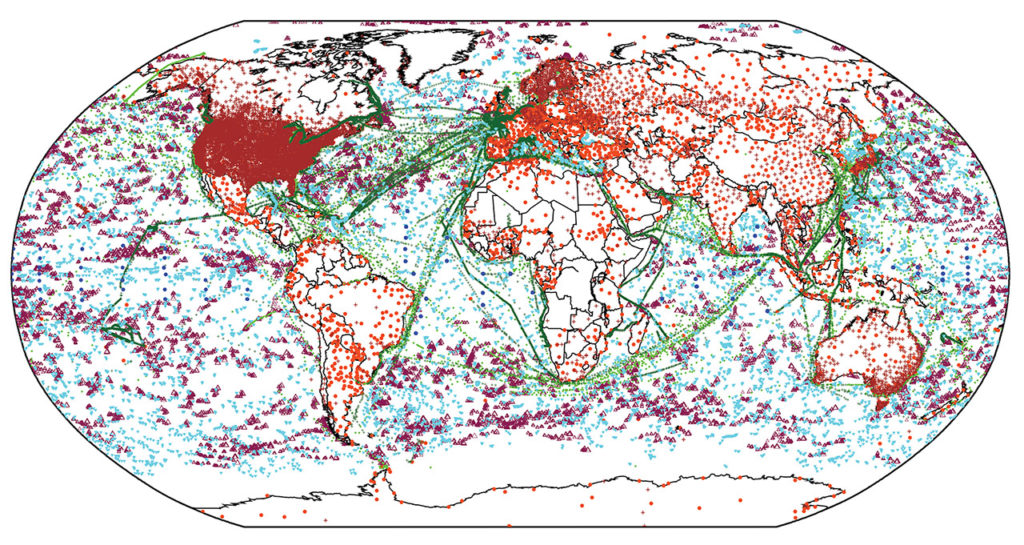
To collect all these data in a single array, to count, taking into account their different origin, take into account all the errors, calibrate and “sew” with the “senior” arrays of data collected in previous years, so that there are no artificial “cooling” and “warming”, is an extremely difficult task.
To verify and calibration, scientists use the re -forecast method: relying on the data of the new Dataset, they try to predict the weather, and then compare how the calculated differed from the real one.
The record of the average global temperature per day we saw on Wednesday in the Climate ReanaLyzer service was obtained using the CFS climate forecast system (Climate Forecast System) of the American NCEP forecasts Center. It was with its help that the average global air temperature was obtained (at a height of two meters) for every past day of 2023.
Dataset, on which the model is based, is assembled from two “glued” fragments with each other - for the period from January 1979 to March 2011 and from April 2011 to the present. It includes data from ground weather stations, probes and satellites with an interval of an hour and a spatial resolution of a half gradus of latitude per half grades of longitude (that is, the model believes that the temperature inside this square is the same).
As the basic value - the average, from which deviations are counted - average measurements are used for the period from 1979 to 2000. From this average record value on July 4 (17.18 degrees Celsius) differs by 0.98 degrees. The former record was set on August 13, 2016 (16.92 degrees) and repeated on July 24, 2022.
A record high average global temperature does not necessarily mean that at some point a record (for this day and for this place) temperature was measured on this day, although this is not excluded. The absolute record of the planet remains the same: the temperature of 56.7 degrees above zero was measured on July 10, 1913 in the death valley in California.
But we can definitely say that the current record is not the result of an extremely hot summer. This is an unusually warm winter - in the southern hemisphere. If you look at the average temperature by hemispheres, you can see that the record for the northern hemisphere is not yet blocked, but in the southern hemisphere, where winter is now, the temperature is higher than the basic average value by 1.01 degrees.
Record day, record month, record year
However, climatologists are unlikely to worry a record warm day: this is just another symptom that indicates climate warming, and this warming has more noticeable and more significant symptoms. The temperature record at one point or in one day can be a fluctuation, random emission, however, the likelihood that fluctuation can be a constant growth of average annual global temperature in recent decades is disappearingly small.
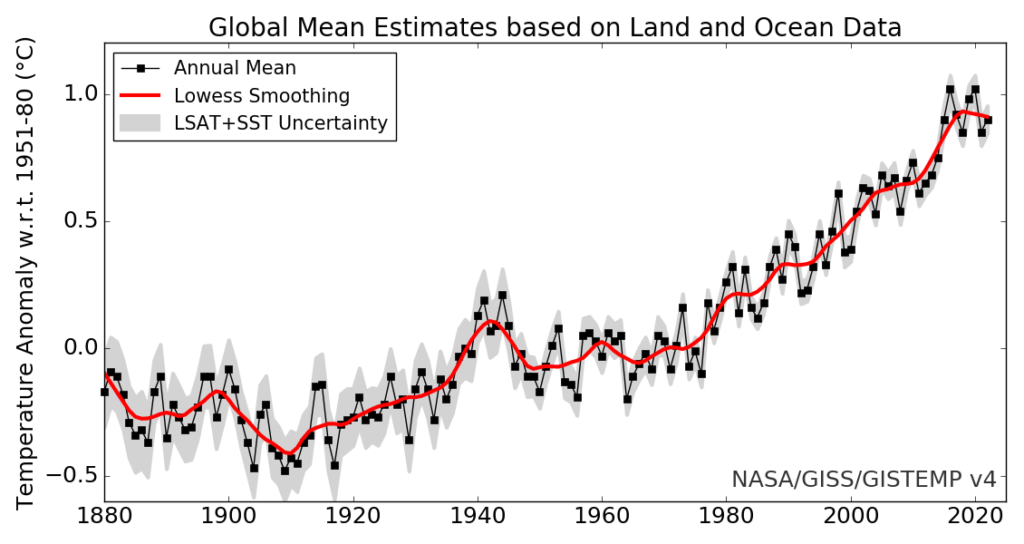
In the record hot in 2016, the temperature over the average value for the period from 1951 to 1980 reached 1.02 degrees, in 2020 the record repeated. Meteorologists expect that in the next five years the absolute record will be updated-under the influence of the climatic phenomenon of El Nino, the beginning of which the World Meteorological Organization has announced the other day. This is an increase in the temperature of the water surface in the equatorial part of the Pacific Ocean, which affects the weather and the climate of a significant part of the planet, provoking droughts and hurricanes. Observations show that a record high annual temperature can be achieved a year after the beginning of El Nigno.
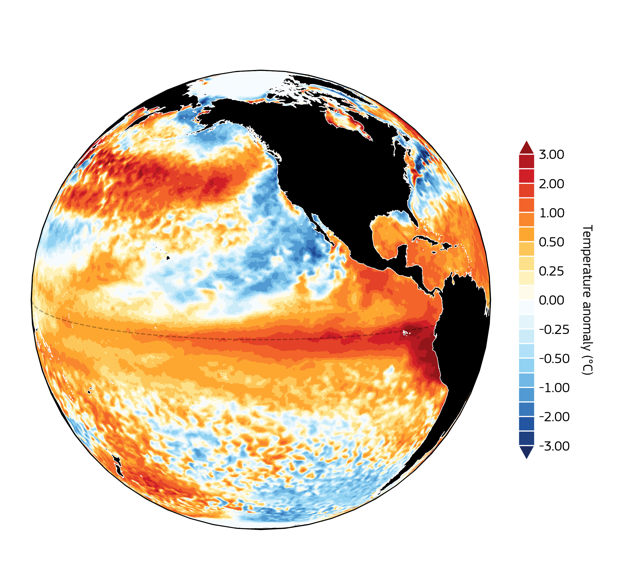
Source: Copernicus Climate Change Service/ECMWF
Climatologists believe that soon the temperature on the Earth will come close to the values that were observed in the Mikulinsky (Eemic) interglacial period - we know about the then temperature due to the analysis of the ice of that era in the Greenland ice shield. “There is a chance that July will be the hottest. The most - in the sense of the time of the Eemic era, which was about 120 thousand years ago, ” says Kareten Haustain from the University of Leipzig.