
Translated material
The result of Davankov was underestimated in several regions
Voices for presidential candidate Vladislav Davankov during the counting of votes were intentionally underestimated in some regions so that he would take third place after Vladimir Putin and Nikolai Kharitonov. This conclusion was reached by a programmer, election researcher Ivan Shukshin. He analyzed data from 98% of polling stations in which they voted in the traditional way (excluding DEG and voting in the occupied territories of Ukraine).
Shukshin told the cold that manipulations with the voices for Davankov and Kharitonov are clearly visible in those regions where the most abnormal voices are most. He defined them by analyzing data on the appearance and results by the Mathematics method by Sergey Spilkin .
“When we look at those polling stations where the turnout is above 70%, we clearly see not only the drawn voices for Vladimir Putin, but also the increase in the votes for Kharitonov. And the voices for Davankov are reduced. We compare this with the distribution of votes in areas where the turnout was less than 70%, such areas look more honest, ”says Shukshin.
As an example, the expert mentioned the Perm Territory: “The Blue Line is the voices of Putin, purple - for Davankov, Red - for Kharitonova, brown - for Slutsky. The horizontal axis of the graphics is a turnout, vertical - votes in support of candidates. When the turnout exceeds 70%, the blue line (Putin) sharply grows up, but these are not the only changes. After 70%, the lines of votes for Kharitonov (Krasnaya) and Slutsky (brown) also grow, and the line for Davankov (purple), which earlier (with a turnout below 70%) towered above the other two candidates, becomes lower than them. ”
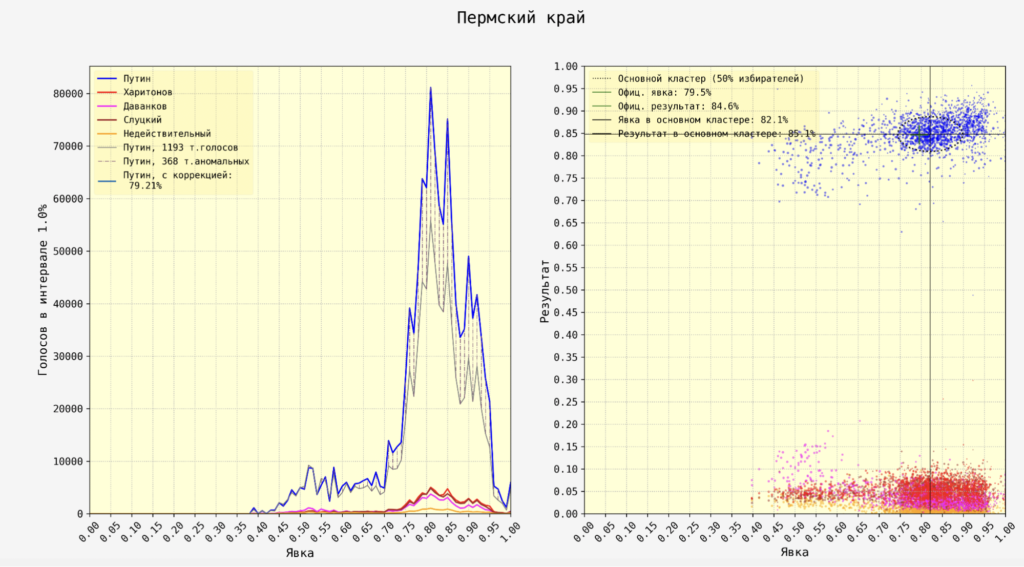
Shukshin says that similar trends are also visible in the analysis of the results in some other regions: with a turnout up to 70% in most sections of Davankov, it takes second place after Putin, but as soon as the turnout is above 70%, the voices for Davankov are falling, and they grow for Kharitonov. For example, similar anomalies are seen in the Republic of Khakassia, Ulyanovsk, Ryazan, Bryansk, Chelyabinsk, Tula and Novosibirsk regions.
In addition to underestimating the votes in favor of Davankov, Shukshin noted that using a mathematical analysis of the data, 22 million votes are visible - this is the largest stuffing in the federal elections in the history of Russia. According to the official version , 87 million people took part in the presidential election. Excluding the 22 million votes thrown out, the real turnout amounted to 65 million - this is about 58% of the total number of voters of Russia.
“The analysis of the data shows that the real turnout really amounted to about 60 percent, but due to such a large number of abnormal voices it is definitely very difficult to say. In my estimate, the turnout was from 58 to 63%, ”says Shukshin.
To receive the main news faster, subscribe to our telegram and twitter .