
Translated material
Miscalculated with the “Dream”
“New Europe” assessed the share of anomalous votes in favor of the party in power in the elections in Georgia. They may be enough to overturn the results
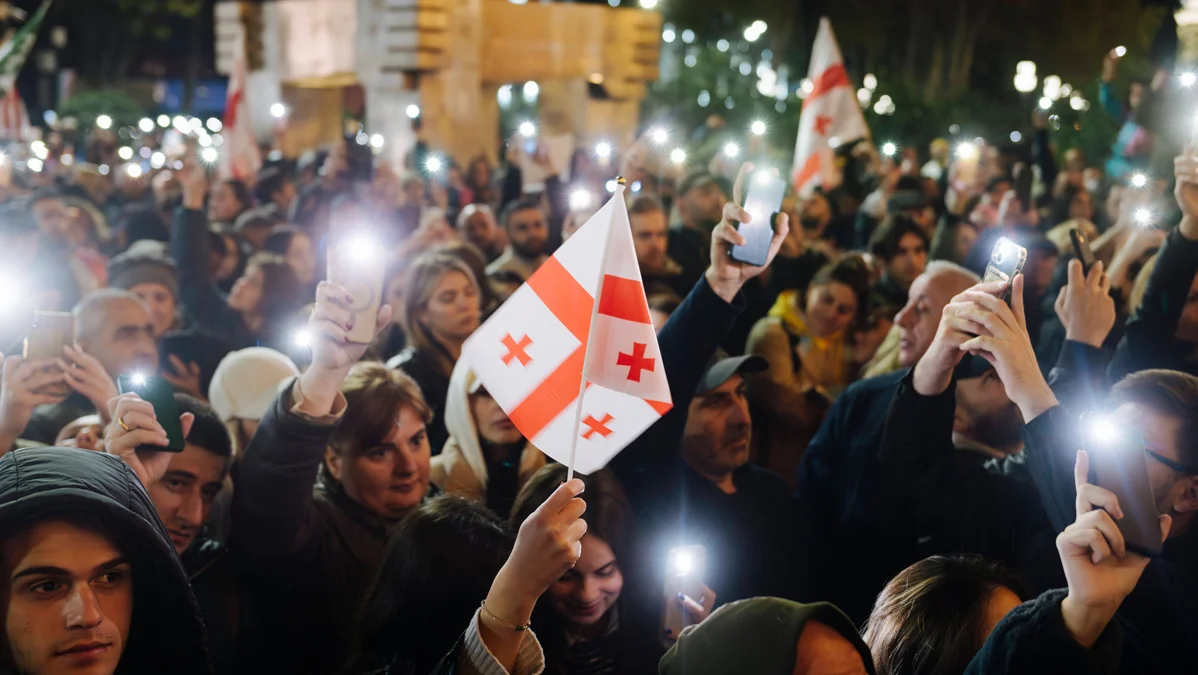
A rally against the election results near parliament in Tbilisi, Georgia, October 28, 2024. Photo: Jan Schmidt-Whitley / Imago Imgaes / Scanpix / LETA
On October 26, parliamentary elections were held in Georgia - in which the pro-Russian Georgian Dream party, according to official data, received 53.92% of the votes. Opposition parties refused to recognize the results and accused the authorities of fraud. Observers and some election analysts also reported violations. Novaya Gazeta Europe studied the findings of electoral experts and conducted its own analysis. We tell you what is known about the scale of fraud and how it could have affected the election results in Georgia.
To assess the integrity of elections in Georgia, you can use the same methods as in Russia - look for anomalies in the results that contradict the laws of statistics. For such an analysis, data on turnout and results for individual polling stations is used; in Russia, this is published by the Central Election Commission. In Georgia, the results are also published, but turnout data is available only in the form of scans of handwritten protocols. This data was digitized by analyst Ivan Shukshin - the conclusions of our text are based on them.
What do election analysts say?
The very next day after the elections, publications with the results of statistical analysis began to appear. They show deviations from the distribution that would be expected in fair elections.
Electoral expert Roman Udot was one of the first to post the results of his analysis. He drew attention to the fact that in polling stations with higher turnout the share of votes for the Georgian Dream is growing - that is, the more people came to the polling station, the higher the percentage of supporters of the ruling party among them (we simplified the author’s reasoning, conveying the main meaning of the argument) . According to this argument, such a pattern should not exist in the case of fair voting. This may indicate the unnatural nature of voting, that is, fraud.
Analyst Levan Kvirkvelia then made similar arguments: he showed that the distribution of rural areas by outcome does not correspond to the Gaussian distribution that would be expected in the case of natural voting. In accordance with the laws of statistics, the number of polling stations with a certain percentage of the winning party should follow a normal distribution, provided that the voting behavior of people in different regions does not differ much and the polling stations do not depend on each other. Kvirkvelia noted that
There were more areas with a high Georgian Dream result than the model predicted, which may indicate markups.
The tweet with this analysis received 2.3 million views, and was even retweeted by the President of Georgia.
However, both of these anomalies can be explained by regional differences.
In the case of the method that Udot uses, this is confirmed by the authors of the article to which he refers. Scientists emphasize that it is virtually impossible to distinguish territorial heterogeneity from falsification when using this method. They cite the example of the difference in voting behavior in East and West Berlin: for example, in the eastern part of the city, voters are less willing to vote and are also less supportive of the Christian Democratic Union of Germany (a conservative political party).
The same argument applies to Levan Kvirkvelia's analysis: there may not be a Gaussian distribution due to regional heterogeneities. Moreover, if we analyze the turnout in polling stations from the zone with an abnormally high result of the winning party, it turns out that the turnout there is slightly lower than the average. In the case of stuffing and falsification, along with the result, turnout should also increase - this is clearly seen in the example of the analysis of elections in Russia. Therefore, the anomalies noticed by Kvirkvelia cannot be explained by stuffing: they are either caused by other types of falsifications, or are a consequence of the same regional differences in voting behavior.
Analyst Maxim Gongalsky in his analysis draws conclusions about regional differences rather than falsifications. In a conversation with Novaya-Europa, he noted that the available data is not enough to say that there was no falsification.
So there were no stuffings?
There were probably falsifications, just not in the form of stuffing. To find out, we independently studied electoral statistics for Georgia. We relied on data digitized by Ivan Shukshin and some ideas from his analysis .
Frauds are usually looked for using a method popularized by physicist Sergei Shpilkin - in which the distribution of votes for a leader (suspected of fraud) in areas with different turnouts is compared with the same distribution for other parties (assuming that their votes were received fairly).
How does the Shpilkin method work?
Shpilkin's method reveals how many votes were added to the winner due to ballot stuffing and rewriting of the final protocols.
To do this, the distribution of votes for different candidates is compared with the turnout at each individual polling station. If the elections were fair, the distributions for the leading candidate and all other candidates should differ only in absolute value due to the different number of votes, but be identical in form.
However, casting for one of the candidates increases both turnout and results. This distorts the distribution. To determine the volume of throwing, you need to sum up the results of everyone except the leader and multiply them by such a coefficient that the curve for everyone else coincides with the leader’s curve. Anything that goes beyond the boundaries of the two figures is considered anomalous voices.
In addition, in Russia, election results in protocols are sometimes completely rewritten - to search for such falsifications, they use the method of counting integer anomalies, when they count the excess of polling stations with integer percentage values of the winner's result or turnout (for example, when Putin gets exactly 80%).
In Georgia, when these methods are used, no obvious falsifications are detected: there are no integer anomalies at all (which indicates that the protocols were not rewritten), and an increase in the leader’s result with an increase in turnout is not visible. If falsifications were used there, then their methods differ from Russian ones.
However, Shpilkin’s method still detects a small level of manipulation—Ivan Shukshin drew attention to this. According to his calculations,
the result of the party in power without anomalous votes is 49.25% (instead of the official 53.92%). The detected anomalies are not similar to those in Russia: they occur mainly in areas with low turnout.
We repeated this analysis. The anomaly is best seen if we divide the areas into rural and urban (we divided them by region numbers, as in the analysis of Roman Udot - in total there were 2063 rural areas and 1047 urban). In rural areas, there is a noticeable slight deviation in the distribution of votes for the Georgian Dream from what would be expected in fair elections. In urban areas, the curves almost completely coincide, from which we can assume that in large cities there were practically no violations (or Shpilkin’s method does not show them). From this analysis, we, like Shukshin, found that the real result of the Georgian Dream is 49%.
Another way to show electoral anomalies is to plot the distribution of polling stations in “turnout-result of the winner” coordinates. In an “ideal” election, we should see a smooth, Gaussian-shaped cloud of dots representing areas, with a clear center and fuzzy edges. In elections in Georgia, outlier areas with low turnout are clearly visible in rural areas, which provide “anomalous” votes detected by the Shpilkin method.
However, Shpilkin's method, like other methods of election analysis, assumes homogeneity of electoral behavior across regions. Therefore, it is impossible to draw clear conclusions about falsification based on this information alone, especially considering that anomalies are observed in areas with low turnout, and not high, as one might expect with stuffing.
Even in countries with fair elections, the “core” may differ from the ideal Gaussian - this has been observed , for example, in Poland, Germany and Spain. To draw conclusions about falsification, additional grounds are needed - in the case of Russia, for example, this is a strong correlation between turnout and the result, indicating stuffing.
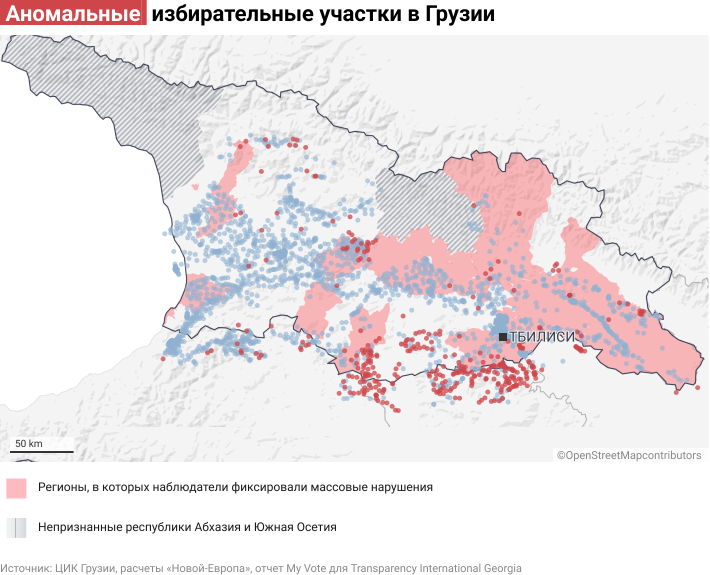
However, Shukshin noted that in Georgia, in those areas in which there are the most anomalous areas, observers at the areas also reported violations. We calculated that 72% of voters from anomalous precincts voted in regions where observers reported widespread irregularities (according to a report by the monitoring organization My Vote for Transparency International Georgia). This shows that the identified anomalies can hardly be explained solely by different electoral behavior along territorial grounds. Rather, in different regions in Georgia there may be different scales of falsification - just like in Russia .
What we thought
To designate “anomalous” areas on the map, we selected those areas that deviate from the two-dimensional Gaussian distribution in the “turnout-result” coordinates. To find them, we first approximated this distribution for rural plots and determined its parameters using the scipy.optimize.curve_fit function in Python. Then we took areas that deviated from the center by more than three sigma - there were 383 out of 2063 rural areas.
In total, there were 329 thousand voters out of 1 million 820 thousand in the anomalous polling stations. Of these, in the regions where observers reported massive violations, there were 209 polling stations with 238 thousand voters - this is 72% of all voters in the anomalous polling stations we identified.
We also note that in many regions where observers saw violations, our analysis does not show significant anomalies - it follows that in this way it is impossible to catch all violations, and the real scale of falsifications may be greater.
If falsified, then how?
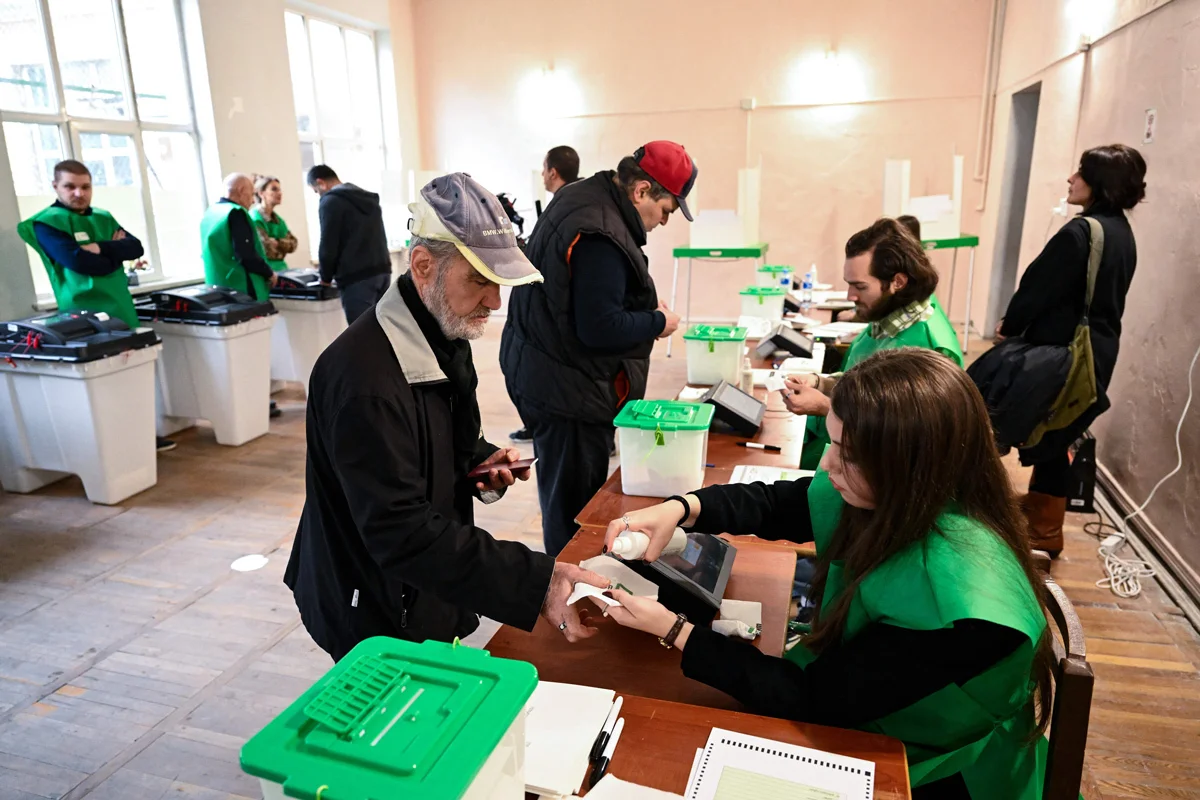
As Ivan Shukshin notes , the voting procedure in Georgia has many degrees of protection. Voter lists are posted on the door of the polling station, including date of birth and address, which avoids stuffing for non-existent people. 89% of voters voted at polling stations equipped with automated complexes for processing ballot papers (KOIP). The ballots counted by the KOIB are then recounted manually.
In this regard, mass stuffing or rewriting of protocols cannot be expected. Roman Udot, who was present in Georgia as an observer, agreed in a conversation with Novaya-Europa that there were no frauds during the counting.
However, the possibility of falsification is not completely ruled out - it’s just that their mechanisms differ from those familiar to Russia. Udot believes that bribery of voters and administrative pressure could be important mechanisms: “People were given benefits so that they would not go to the polls, not vote for the Georgian Dream, but also not vote for the opposition. Their passports were taken away, allegedly to process this benefit. Apparently they voted for them.” This type of bribery (assuming that not all people who turned in their passports were voted for) would create low turnout in anomalous areas, as we observe in our analysis. Udot notes that this scheme was implemented through high-ranking CEC officials.
The observer organization My Vote writes in its report that a complex scheme for falsifying the results was developed in these elections. Like Udot, they point out that the ruling party collected documents and data from voters in order to put pressure on them. Transportation of voters to the polling stations was also organized. The scheme of falsifications also included repeated voting. Besides,
There were cases when voters were given ballots with a candidate already marked. The observers' work was obstructed, including through physical attacks.
Ivan Shukshin, who observed the elections at polling stations in Georgia, believes that one of the violations was the counting of invalid ballots in favor of the party in power. Also, according to him, at some polling stations there were cases of repeated voting by the same voters.
What was the impact of the violations?
Our calculation showed that the violations were unlikely to add more than 5 percentage points to the ruling party. votes. Despite the fact that its actual result could be less than 50%, this does not change the party’s position much: in any case, it would have had a relative majority of seats in parliament. It would have additional powers only in the case of a constitutional majority (this is two-thirds of the mandates) - then Georgian Dream could independently amend the constitution.
However, in accordance with Georgian legislation , in order to cancel an election, it is enough that at least 10% of all voters in Georgia are registered in the polling stations where the elections were declared invalid due to violations. If the anomalies that we found in our analysis are precisely violations and not regional differences, then there could be just about 10% of voters in such polling stations. In this case, repeat elections must be held.
What we thought
As we showed above, in rural areas that are more than three sigma out of the “honest” core, 329 thousand voters are registered. This is 9% of the total number of voters (3.63 million).
The calculation can be made more strictly, since the three-sigma limit is chosen randomly. If we restore the smooth distribution (two-dimensional Gaussian function) with the parameters obtained as a result of the approximation, we obtain that the difference between the number of sections in this distribution and the real number of sections will be 443 sections. However, this is a statistical result - we do not know which polling stations these are and how many voters there are. If we assume that the average number of voters in anomalous precincts is equal to the average number of voters in three-sigma precincts (859 voters), then in total there were 381 thousand voters in 443 anomalous precincts, or 10.5% of the total number of voters in Georgia.
It should be taken into account that electoral statistics can only indicate the approximate scale of fraud. But evidence in court must be violations in specific areas recorded by observers. This evidence is consistent with statistical analysis - it also follows that more than 10% of voters were in polling stations with violations. If these violations can be proven, this may be grounds for holding repeat elections.