
Translated material
Miracles continue
The presidential elections have added material for statistical research (see articles dedicated to the Duma elections on December 4, 2011, in the TRV No. 94, 96, 98). Briefly about some interesting moments of past elections - in this article of independent expert Sergei Spilkin.
The return of Moscow
Let's start with the good. Apparently, thanks to the political activity of recent months and, of course, thanks to the work of many observers, the counting of votes in Moscow was carried out this time, if not impeccably, then at least accurately enough. As a result, a strange spread of voting results in areas and areas immediately disappeared, which supporters of the hypothesis of an honest counting of votes in previous elections attributed to a certain “social stratification”.
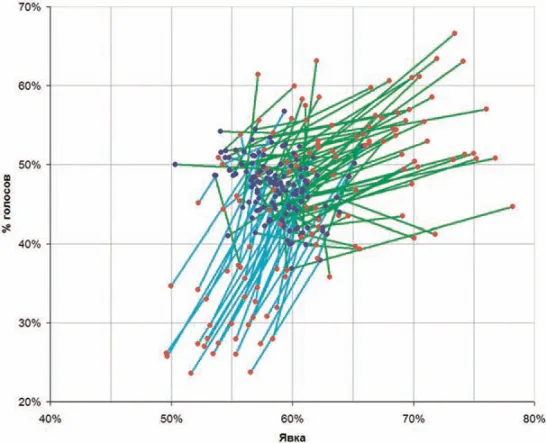
Moreover, since Putin’s final result in Moscow (46.95 %), with an accuracy of a percentage, coincided with the result of “United Russia” in the December elections (46.15 %) and the turnout also turned out to be almost the same (58.3 and 61.7 %), there was a paradoxical situation: in those areas where in December “United Russia” received the most votes (and where, as a rule, it was, as a rule, it was as a rule. An increased turnout was registered), the result of Putin was lower than the result of “United Russia”, and the turnout is lower than in the Duma elections. Both that and the other look very strange: the appearance in the presidential election is traditionally higher than in parliamentary, and Putin’s popularity is undoubtedly more popular by the party he headed. Now those who believe that in the December elections to the State Duma in Moscow there were no falsifications, they will have to explain where the strange supporters of the EP came from in Moscow (and only in half the districts) who did not vote for Putin.
The results of voting in the Duma elections are widely and randomly scattered, on the presidential - collected in a compact cluster. It is also worth noting that the expected Duma - presidential elections for a pair of turnout and the result on the latter occurs significantly more naturally from the area to the area (the blue lines are almost parallel) than the difficult to explain decrease: the green lines are very confused.
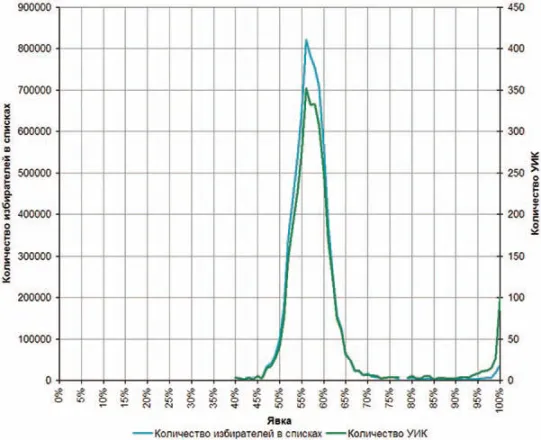
An honest counting of votes in Moscow immediately reflected on the histogram of the number of polling stations (and the number of voters registered on them), depending on the turnout.
There was no such narrow symmetrical distribution of voting activity in Moscow in Moscow in 2005: already in the Duma elections of 2007, the distribution had a noticeable tail in high turnouts, and in the 2008 presidential elections, the Moscow City Duma and the Duma elections of 2011, it took a variety of bizarre forms (see graphics in [1], [2]) who stubbornly explained the supporters of the theory of honest counting with social factors. Now, either in Moscow they finally built communism, or something else, but it was worth organizing the observation of the elections-and the social factors disappeared. A similar form of a narrow peak has acquired the distribution of plots by the percentage of votes for the candidate of the authorities, which in the past elections also looked strange.
St. Petersburg miracles
Not everywhere, however, the picture is so rainbow. If in Moscow the distribution of the votes received by candidates in areas with different attendants are similar and do not show a noticeable superiority of the candidate of the authorities with high attendants, in St. Petersburg V. Putin in areas with a high turnout has a clear advantage.
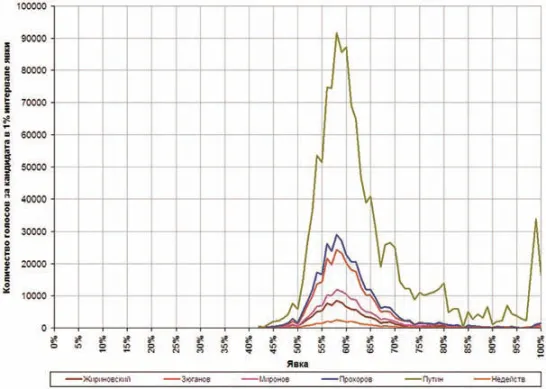
In addition to the very fact of increased voting for V. Putin with high turnouts and a clear maximum on the appearance of 80 %, it is worthwhile to separately note the peak of voting for V. Putin in areas with a turnout of 97-100 %-it seems, in the capital's cities, it still has not been. This peak gives V. Putin about 70 thousand votes of 1.2 million officially filled for him in St. Petersburg, and the total excess number of votes filed for Putin in areas with a high turnout, calculated according to these histograms, is approximately 200 thousand.
All of Russia
In Russia as a whole, a picture of voting statistics is less flagrant than, for example, in the 2008 presidential election (see, for example, [3]). It seems that our elected system is gradually learning not to draw round indicators of turnout - the peaks in the distribution of votes for the power candidate at the beautiful values of the turnout (“saw Churov”) almost disappeared - but excess voting for Putin in areas with a high turnout remains.
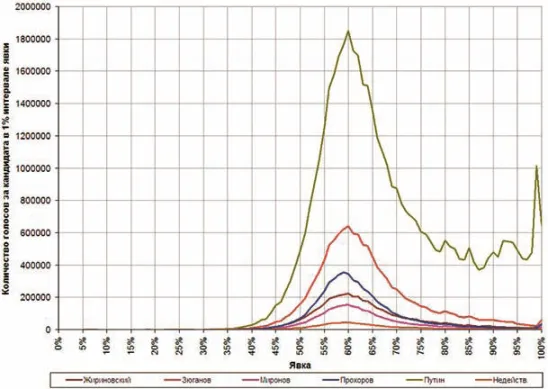
The total number of excess votes for V. Putin in areas with a high turnout, calculated according to the data for 93.5 thousand polling stations (full data on the plots and official voting results at the time of writing were not yet published), is about 10 million of 45 million submitted for Putin. Correction of voting results with subtracting these additional votes reduces the turnout compared to the official by about 9.4 %, and the result of the winner by the candidate is approximately 6.2 %.
Another interesting point in the current elections is the vote for Mikhail Prokhorov. In Fig. 4 It can be seen that the distribution of votes for it differs from the distribution of votes for other candidates with a more acute peak in the vicinity of medium -sized causes typical of urban voters. It can be assumed that this sharp peak corresponds to Moscow and a number of cities where Prokhorov showed a high result. For more accurate assessments of the volumes of elected manipulations, it is necessary to distinguish and separately consider such cities in order to take into account the “Prokhorov effect”.
2. Http://trv-science.ru/2011/12/20/ Matematika-vyborov-2011/